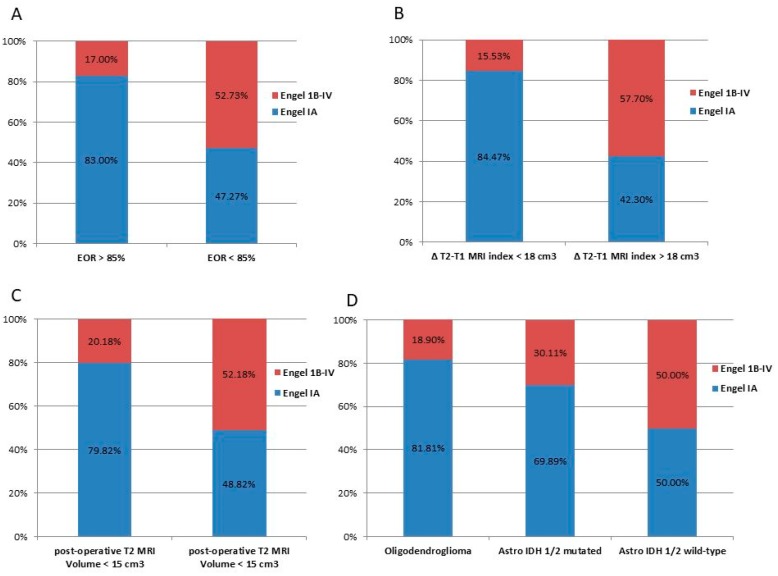
Figure 2.
Graph illustrating 18-months postoperative seizure outcome stratified by the significant variables at univariate analysis. Blue bars indicate patients in Engel Class IA; yellow bars indicate those in Engel Class IB or above. Individual bar totals are the total number of patients with postoperative seizures within each category. (A) Distribution of patients stratified by the EOR; (B) Distribution of patients stratified by the preoperative tumor growing pattern expressed by the ΔT2T1 MRI index; (C) distribution of patients stratified by the residual tumor computed on T2 weighted images; (D) distribution of patients stratified by the molecular class according to the 2016 WHO classification.

