
Table 1.
Markers of MSC senescence and techniques most frequently used for their detection.
| Senescence Marker | Techniques for Detection | Senescent Features, Pros and Cons | ||
|---|---|---|---|---|
| Cell morphology |

|

|
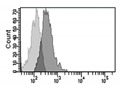
Microscopy [185] Flow cytometry [186] (FSC for size, SSC for granularity) |
Senescent MSCs show enlarged and granular cell morphology. Microscopic assessment is easy but only qualitative. Flow cytometric assessment is quantitative |
| CFU |
|
Colony formation in agar culture [187] |
The CFU number is a measure of cell clonogeneity and decreases with MSC age. CFU assessment requires careful plating at low density. | |
| Sa-β-gal |
|
Microscopy (colorimetric activity assay with X-gal) [188] Flow cytometry (fluorimetric activity assay with C12FDG) [189] IHC, IF or WB with specific Abs (protein expression) [190] |
Senescent cells at low density express a lysosomal β-galactosidase active at pH 6.0, detectable either with activity assays or with a specific antibody. The activity assays can give altered results on high density cultures [191] |
|
| 8-oxo-dG |
|
IHC, IF, ELISA [192], HPLC [192]-MS/MS |
8-oxodG is a DNA base derivative, robust marker of oxidative DNA and RNA damage | |
| γH2AX |
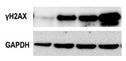
|
IF Flow cytometry [193] WB |
Histone H2AX phosphorylation is an indirect measure of DNA double strand breaks due to physical, chemical, oxidative stress. It indicates that cells organize a DNA damage response, but its persistence sustains senescence of the cells. |
|
| Telomeres |

|
Southern blotting [170] Flow FISH [194] Real-time PCR [194] STELA [195] |
Telomere attrition is directly correlated to replicative senescence, but it also occurs after exposure to oxidative damage. The subpopulation heterogeneity must be taken into account and may be addressed with emerging techniques such as STELA, detecting individual telomere length. | |
| MSI |
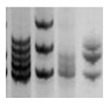
|
PCR followed by gel or capillary electrophoresis [196] |
Repeated sequences variations are an indirect indication of genomic instability and deficient DNA repair due to replicative or oxidative stress. They increase with cell aging. | |
| Gene expression of senescent markers at mRNA level |
|
Real-time RT-PCR [33] Microarray RNAseq |
Expression of genes related to senescence. Several pathways can be analyzed, but gene expression analysis prevalently focuses on p53 and cyclin dependent kinase inhibitors (p16 and p21) | |
| Expression of senescent markers at protein level |
|
WB [197] IHC IF Flow cytometry |
Evaluation of the expression levels of proteins related to senescence (p16, p21, p53, etc.) | |
| Global methylation |
|
NGS after bisulfite treatment [198] | Genome wide analysis of methylated cytosines. | |
FSC: forward scatter; SSC: side scatter; CFU: colony forming unit; X-gal: galactosidase substrate; C12FDG: fluorogenic galactosidase substrate; IHC: immunohistochemistry; IF: immunofluorescence; WB: western blotting; ELISA: enzyme-linked immunosorbent assay; HPLC-MS: high performance liquid chromatography-mass spectrometry; 8-oxo-gG: 8-Dihydro-8-oxo-2’-deoxyguanosine; γH2AX: phosphorylated H2A histone family member X; FISH: fluorescence in situ hybridization; STELA: single telomere length analysis; PCR: polymerase chain reaction; RT-PCR: reverse transcriptase PCR; NGS: next generation sequencing.