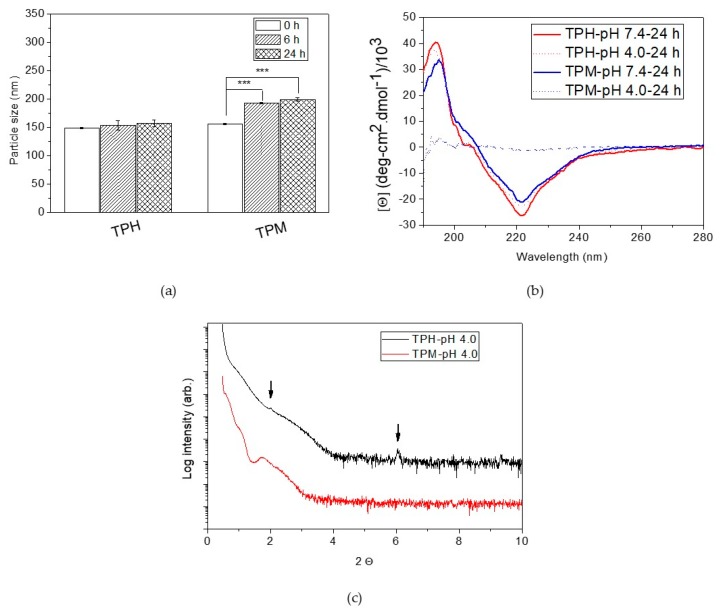
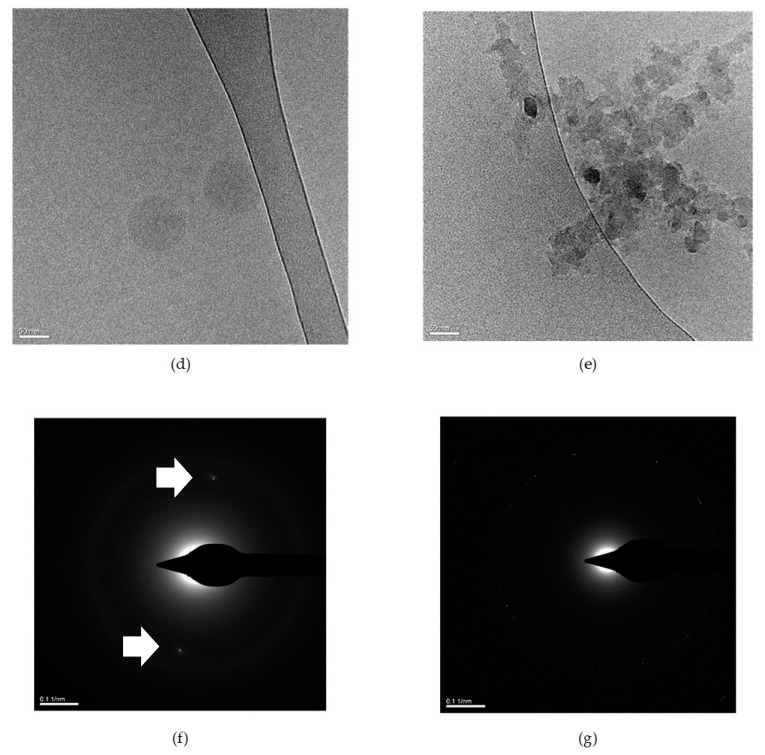
Figure 2.
pH-Responsiveness of the mixed micelles. (a) The particle sizes of the TPH and TPM mixed micelles were measured by DLS in pH 4.0 condition after incubation at 37 °C for 6 and 24 h. (b) The CD spectrum of micelles were conducted to determine their secondary structures. (c) XRD patterns of the TPH and TPM mixed micelles after acidic treatment for 24 h. A cryoTEM was utilized for morphological observation of TPM micelles after incubation at pH 7.4 (d) and 4.0 (e) for 24 h. The diffraction images of TPM mixed micelles at pH 7.4 (f) and pH 4.0 (g) were simultaneous undergone to further conduct the crystalline alignment. Asterisk markers indicate significant difference in statistics (***p < 0.005).


