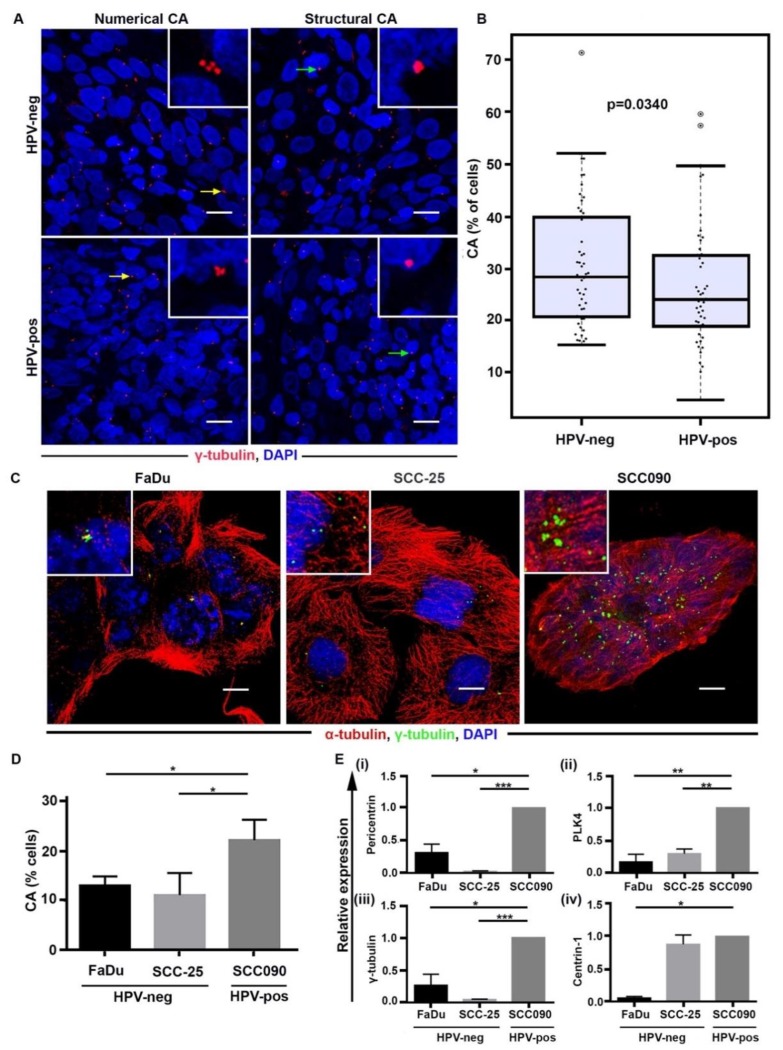
Figure 1.
HPV-neg OPSCC specimens exhibit higher CA when compared with the HPV-pos OPSCCs. (A) Confocal immunomicrographs showing numerical and structural CA in HPV-pos and HPV-neg OPSCC sections. OPSCC tissue sections were immunostained for centrosomes (γ-tubulin, red) and counterstained with Hoechst (blue). Scale bar (white), 20 μm. (B) Percentage distribution of cells with CA (structural and numerical) in HPV-neg (n = 51) and HPV-pos (n = 47) patients (p < 0.0340). (C) Confocal immunomicrographs showing numerical CA in HPV-pos and HPV-neg tumor cells. OPSCC cells were immunostained for centrosomes (γ-tubulin, green), microtubules (α- tubulin, red) and counterstained with Hoechst (blue). Scale bar (white), 20 μm. (D) Percentage distribution of cells with CA (structural and numerical) in HPV-neg and HPV-pos cells (p < 0.05). (E) qRT-PCR analysis of mRNAs for γ-tubulin, pericentrin, centrin-1, and PLK4 in FaDu, SCC25, and SCC090 cells. Data were normalized by the amount of GAPDH mRNA, expressed relative to the corresponding value for all the cells and are means ± SD from triplicate data. * p ≤ 0.05, ** p ≤ 0.01, *** p ≤ 0.001, **** p ≤ 0.0001.

