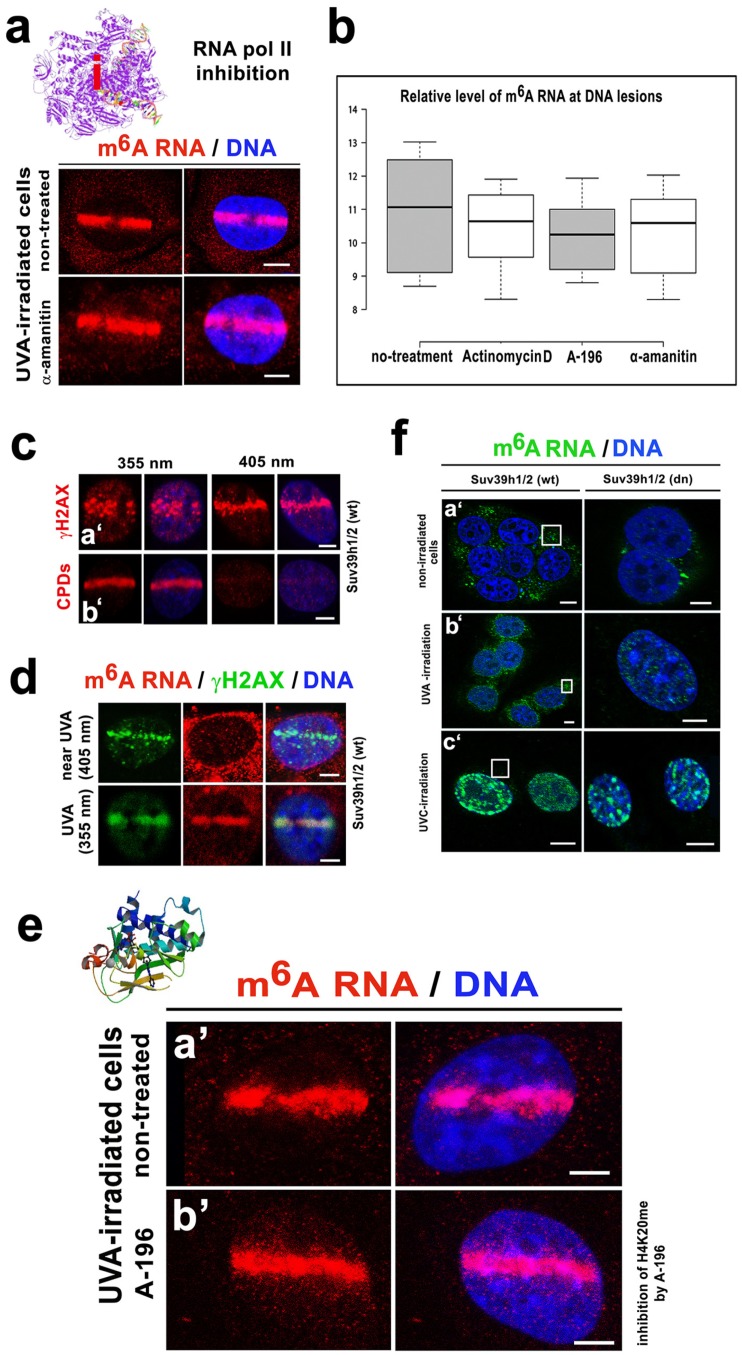
Figure 4.
m6A RNAs were present at only CPD-positive chromatin, and inhibitors of RNA pol I and RNA pol II did not affect the m6A RNA level in the microirradiated regions. (a) An inhibitor of RNA pol II, α-amanitin, did not affect m6A RNA levels at the DNA lesions. For an illustration of RNA pol II inhibition (red i), the RNA pol II elongation complex was adapted from the PDB database [51]. (b) Summary of the inhibitory effects (treatment by actinomycin D, A-196, and α-amanitin) on m6A RNA levels. Quantification was performed according to microirradiated ROIs. (c) Chromatin with (a’) γH2AX positivity in microirradiated ROI and (b’) with/without CPDs. Results are shown after exposure to the 355-nm laser or 405-nm laser line. (d) Panels show DNA lesions (absent of CPDs) induced by the 405-nm laser line. The 355-nm laser-induced both γH2AX and m6A RNAs in the microirradiated genome. (e) In comparison to (a’) nontreated cells and (b’) an inhibitor of H4K20me2/me3, A-196 did not affect the level of m6A RNAs in the microirradiated chromatin. A structure of the inhibitor of the SUV4-20h1/h2 methyltransferases, the compound A-196, was adopted from the PDB database (it is an example of H4K20me inhibition) [41]. (f) Nuclear distribution of m6A RNAs in a’ nonirradiated, b’ UVA irradiated, c’, and UVC irradiated MEFs (whole-cell cultures were irradiated). White frames show the level of m6A RNAs in the cytoplasm. The scale bar in panel (a) represent 8 µm; in panels c, a’, and b’ they represent 10 µm; in panels d,e 5 µm; in panels fa’,b’ bars are 5 µm; and in panels fc’ it is 10 µm in Suv39h1/h2 wt cells and 15 µm in Suv39h1/h2 dn cells.

