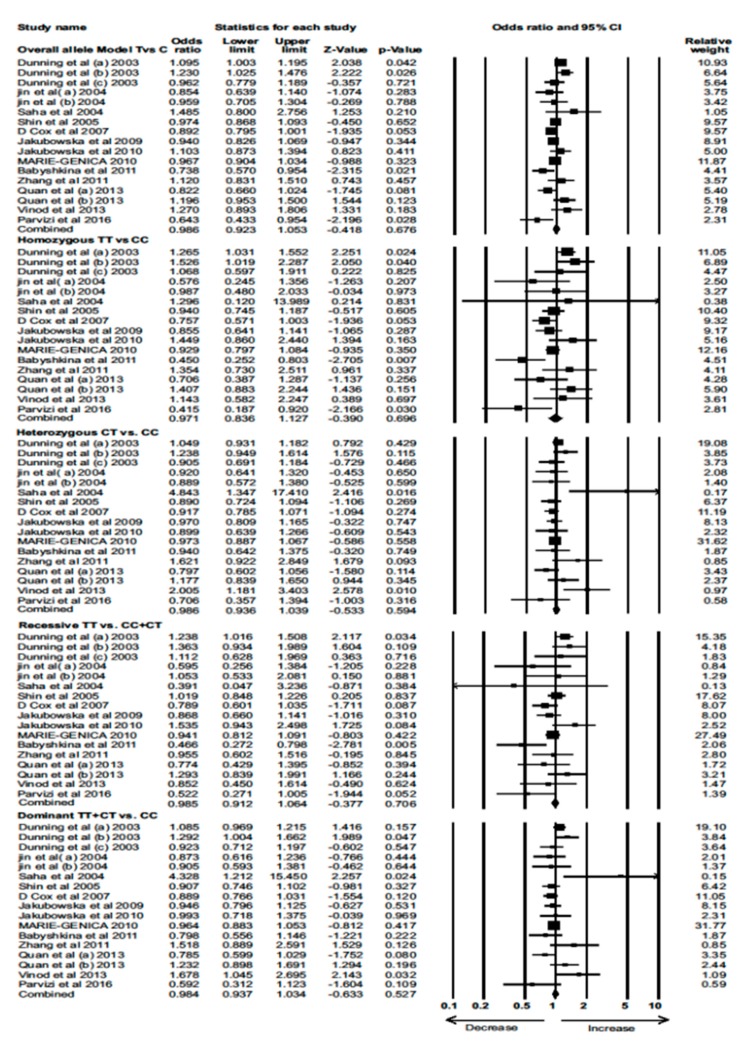
Figure 3.
Forest plot of overall allele and genotypic analysis of the TGF-β1-509 C/T polymorphism and assessment of its association with BC risk using combined odds ratios (ORs) and 95% confidence intervals (CIs) of the ORs. Black squares represent the ORs of the individual studies, and horizontal lines indicate the 95% CIs of the ORs.

