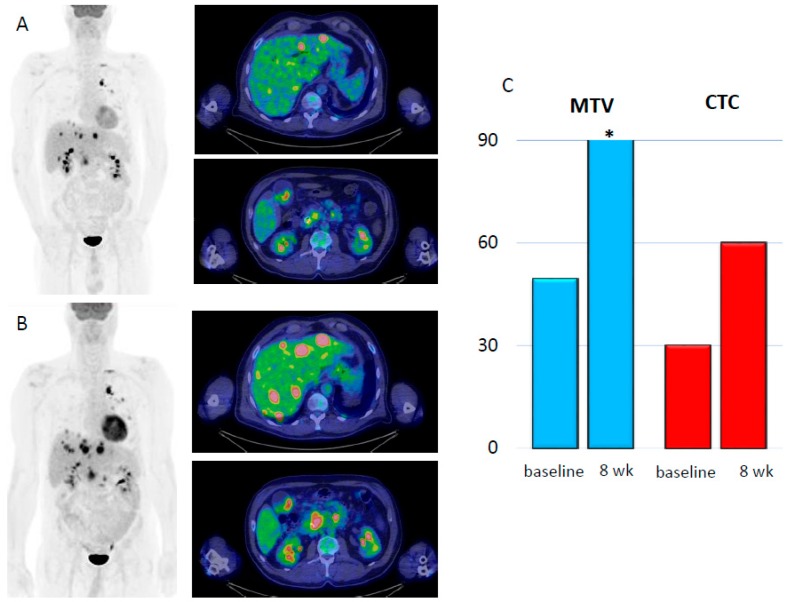
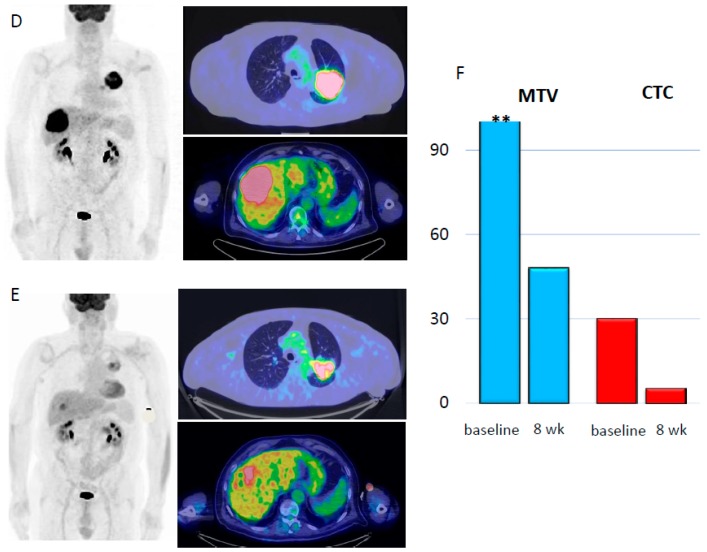
Figure 3.
Two cases of progression (A–C) and response (D–F) to ICI according to metabolic parameters and CTC evaluation. (A) Maximum intensity projection (MIP) with two axial slices of liver and celiac node metastases at baseline. (B) Increase of tumor burden and appearance of further metastatic sites within the liver and in the abdominal nodes at the first restaging. (C) Bar graph representation of MTV (blue bars) between the baseline (49.4 mL) and the first restaging (97.2 mL). Likewise, CTC count (red bars) increased from 30 to 60. (C) MIP with two large lesions within the lung and liver at baseline. (D) 18F-fluorodeoxyglucose positron emission tomography/computed tomography (18F-FDG PET/CT) at 8 weeks, which demonstrated a decrease of overall tumor burden. (F) Bar graph representation of MTV (blue bars) at baseline (256.5 mL) and at 8 weeks (48 mL). Likewise CTC count (red bars) decreased from 30 to 5, * MTV= 97.2 mL; ** MTV= 256.5 mL.


