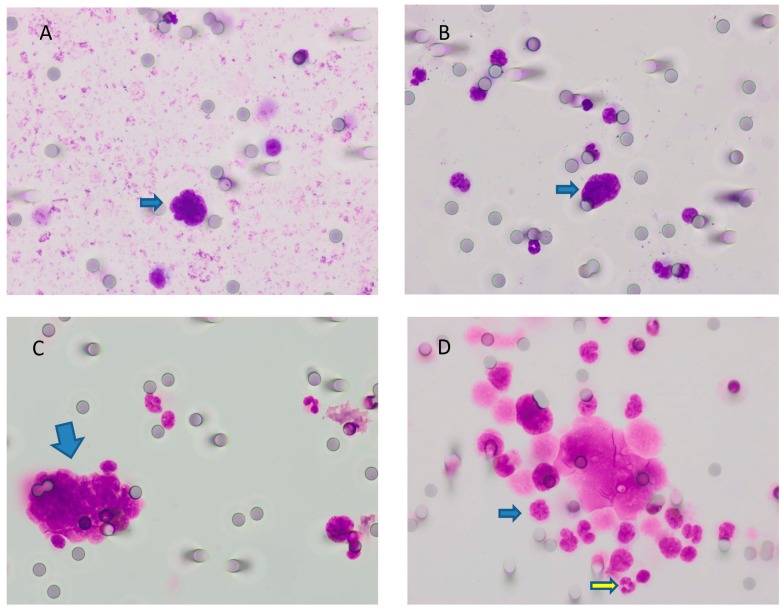
Figure 4.
Comparison of positive (A–C) and negative findings (D) for CTC visualized by May–Grünwald–Giemsa (MGG) staining at 40× magnification. (A) Naked nucleus (without cytoplasm), intensely stained (hypercromatic), with irregular shape and scalloped borders, suspect for carcinoma. The absence of a clearly visible cytoplasm did not permit the evaluation of the nuclear/cytoplasmic ratio. (B) The same as the previous image; herein, we can compare the size of the naked nucleus (arrow) with the size of neighboring leukocytes (around 3–4 times bigger). (C) A cluster of cells with a high nucleus/cytoplasm ratio, hypercromasia, and irregular shape of nuclei. Additionally, cells were bigger than leukocytes. (D) Some of the cells in this sample were degenerated. We did not take into account these cells. The remaining population (for example, the cell indicated by the blue arrow) had a nuclear size somewhat similar to that of leukocytes (yellow arrow). Where cytoplasm was present, it was granular. Thus, all of these cells were probably leukocytes. * CTC = circulating tumor cells; MGG = May–Grünwald–Giemsa.

