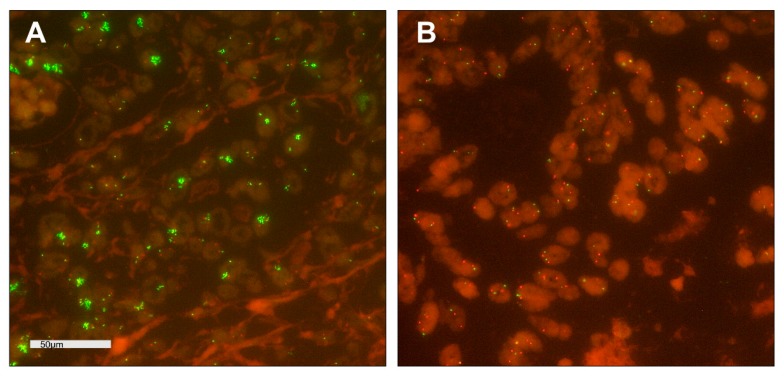
Figure 3.
Fluorescence in-situ hybridization (FISH) analysis of GATA6 in arrayed esophageal adenocarcinomas; magnification ×630; Copy Number Variations; GATA6 ≙ green; CEN18 ≙ orange; (A) tumor cells with cluster amplification of green GATA6 signals; (B) tumor cells with normal distribution of GATA6 and CEN18 signals.

