Figure 3.
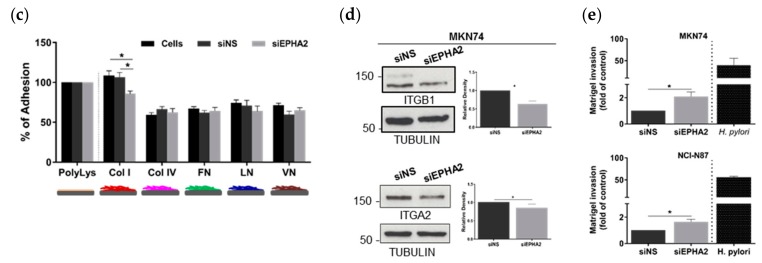
Role of EPHA2 in cell–cell and cell–matrix adhesion and invasion of gastric cells. Representative images of the slow aggregation assay for (a) MKN74 and (b) NCI-N87 gastric cells untreated (cells) transfected with a nonsilencing siRNA (siNS) or with a EPHA2 siRNA (siEPHA2); **** p < 0.0001, ** p < 0.01, ns—not significant (p > 0.05). Cell–cell aggregate size quantification for each condition using Quantity One software. Representative Western blot of the EPHA2 protein expression and the densitometric quantification of the EPHA2 levels in all slow aggregation assays (n = 4). (c) Cell–matrix adhesion of nontransfected siNS or siEPHA2-transfected MKN74 cells to different substrates using poly-L-lysine-coated cells as the maximal adhesion (100%); * p ≤ 0.05. (d) Protein expression of the integrins beta 1 (ITGB1) and alpha2 (ITGA2), a major receptor for collagen type I, assessed by Western blot and respective densitometric quantification (n = 2); * p ≤ 0.05. (e) In vitro Matrigel invasion assay of MKN74 and NCI-N87 cells either transfected with siNS or siEPHA2 upon infection with H. pylori 26695 strain as a control; * p ≤ 0.05. Student’s t-test and one-way ANOVA with post-hoc Tukey’s test.


