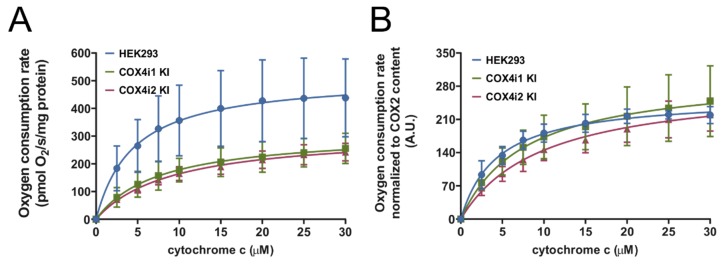
Figure 2.
COX activities normalized to the protein concentration (A) or COX2 subunit content (B). COX activities in Tween-20 extracts of isolated mitochondria measured as oxygen consumption using Oxygraph-2k (Oroboros) at increasing concentrations of cytochrome c (0–30 µM) are plotted as the mean ± S.D. value of three (HEK293, blue) and nine (three replicates of three clones each) COX4i1 (green) and COX4i2 KI (magenta) cells each. Hyperbolic fit of the Michaelis-Menten function is shown as full lines in respective colors.

