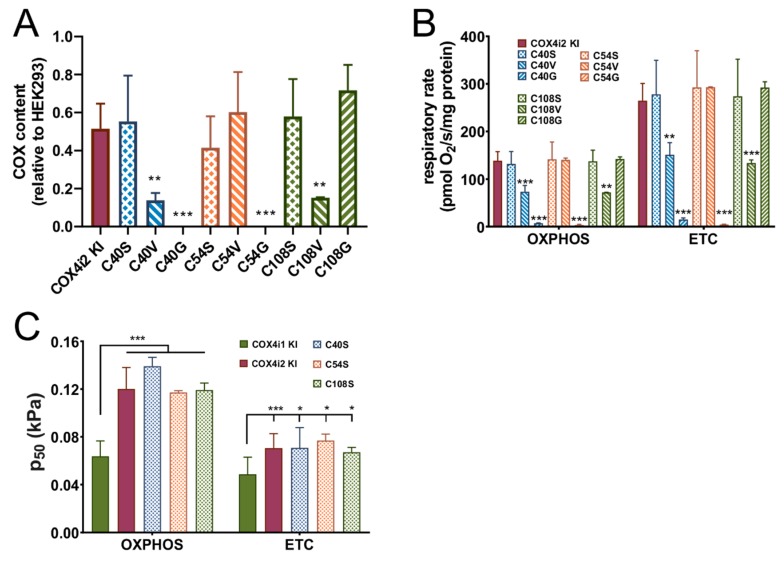
Figure 4.
The COX content and respiration of COX4i2 cysteine substitution mutant KI cell lines. (A) The COX content calculated as the COX2 subunit quantified in the WB immunodetection experiment, normalized to citrate synthase, and expressed in % relative to the COX2 content in parental HEK293 cells, is plotted as the mean ± S.D. value of two measurements in each COX4i2 cysteine-substitution mutant KI cell line as indicated below the graph compared to wild-type COX4i2 KI (magenta, n = 9). ** p < 0.01, and *** p < 0.001 mark significant differences between individual mutant cysteine KIs and wild-type COX4i2 KI. Respiratory rates (B) and p50 (C) in OXPHOS and ETC states are plotted as the mean ± S.D. value of two measurements in each COX4i2 cysteine-substitution mutant KI cell line as indicated below the graph compared to wild-type COX4i2 KI (magenta, n = 12). * p < 0.05, ** p < 0.02, *** p < 0.001 mark significant differences between individual mutant cysteine KIs and wild-type COX4i2 KI in (B) or between COX4i1 KI and wild-type or mutant variants of COX4i2 KI cells (C).

