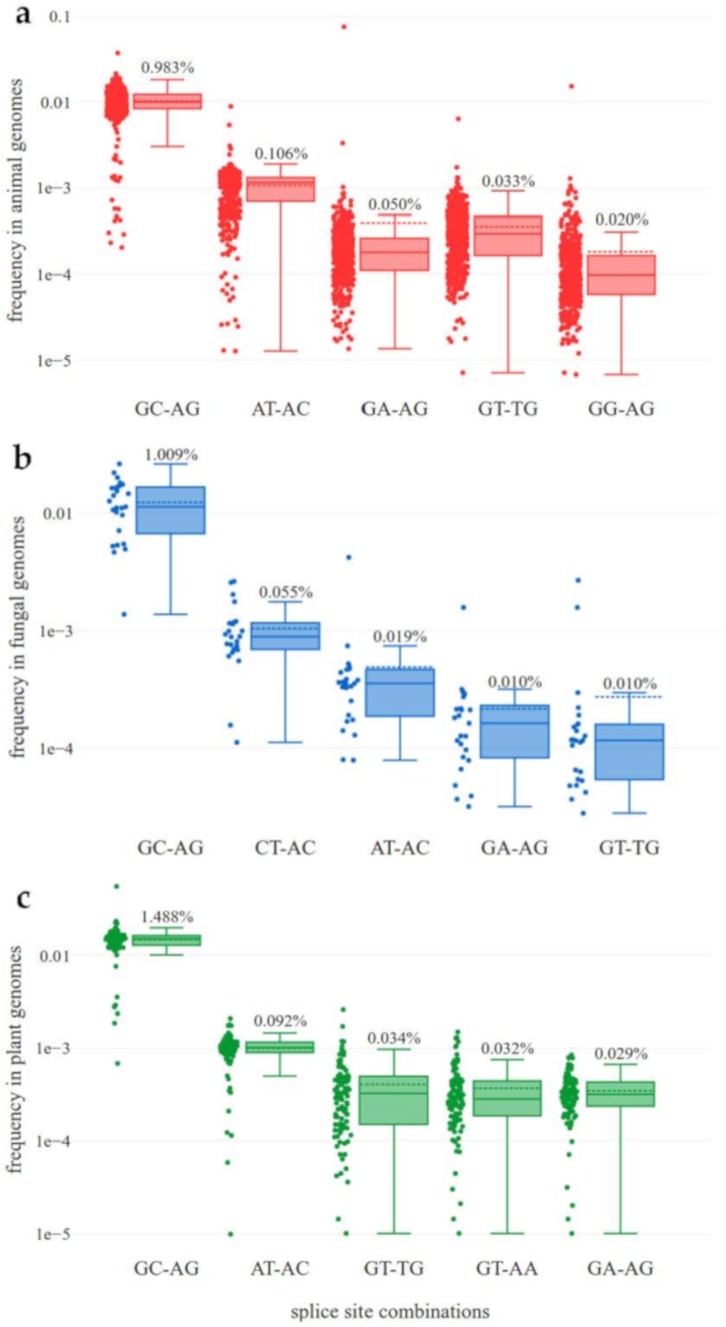
Figure 1.
Frequencies of non-canonical splice site combinations in animals, fungi, and plants. The frequency of non-canonical splice site combinations across the 489 animal (red, a), 130 fungal (blue, b), and 121 plant (green, c) genome sequences is shown. Normalization of the absolute number of each splice site combination was performed per species based on the total number of annotated splice site combinations in representative transcripts. The frequency of the respective splice site combination of each species is shown on the left-hand side and the percentage of the respective splice site combination is shown on top of each box plot. The dashed line represents the mean frequency of the respective splice site combination over all investigated species. The box plots are ordered (from left to right) according to the mean frequency.

