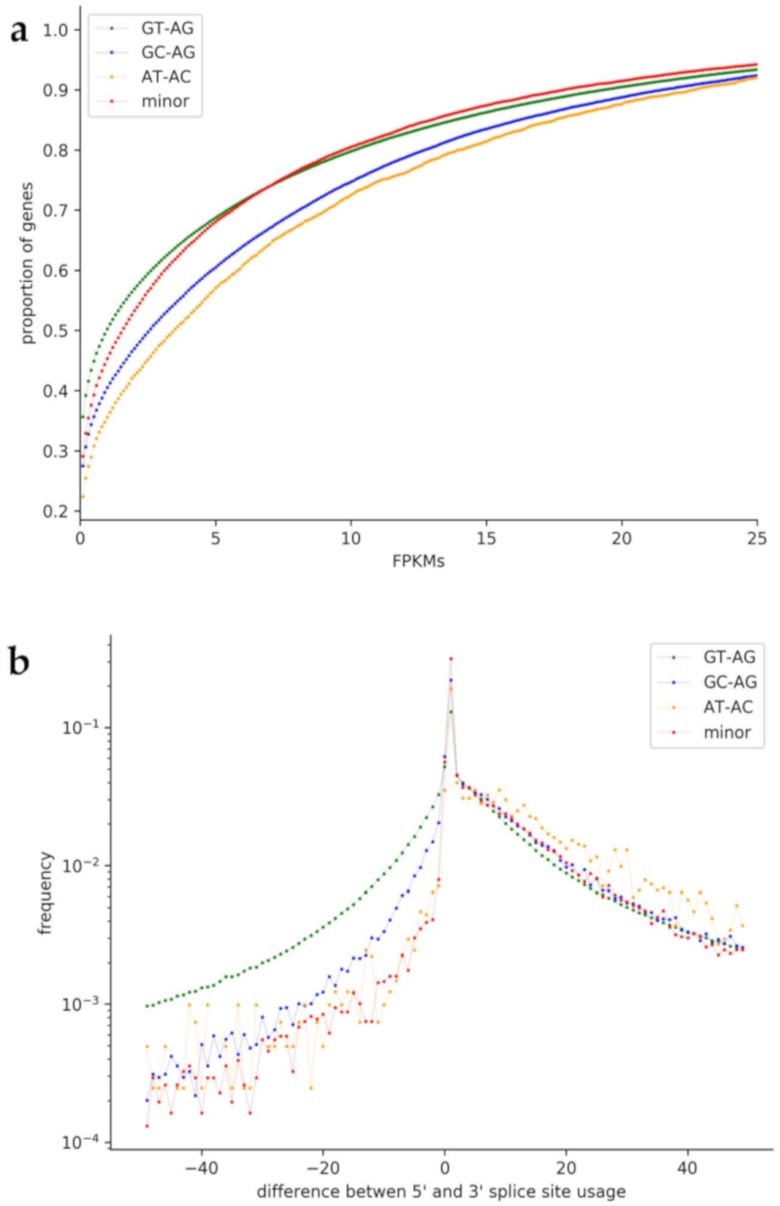
Figure 4.
Usage of non-canonical splice site combinations in plant species. (a) Comparison of the transcript abundance (FPKMs) of genes with non-canonical splice site combinations to genes with only canonical GT-AG splice site combinations. GC-AG and AT-AC containing genes display especially low proportions of genes with low FPKMs. (b) Comparison of the usage of 5′ and 3′ splice sites. On the x-axis, the difference between the 5′ splice site usage and the usage of the 3′ splice site is shown. A fast drop of values when going to the negative side of the x-axis indicates that the 3′ splice site is probably more flexible than the 5′ splice site.

