Figure 1.
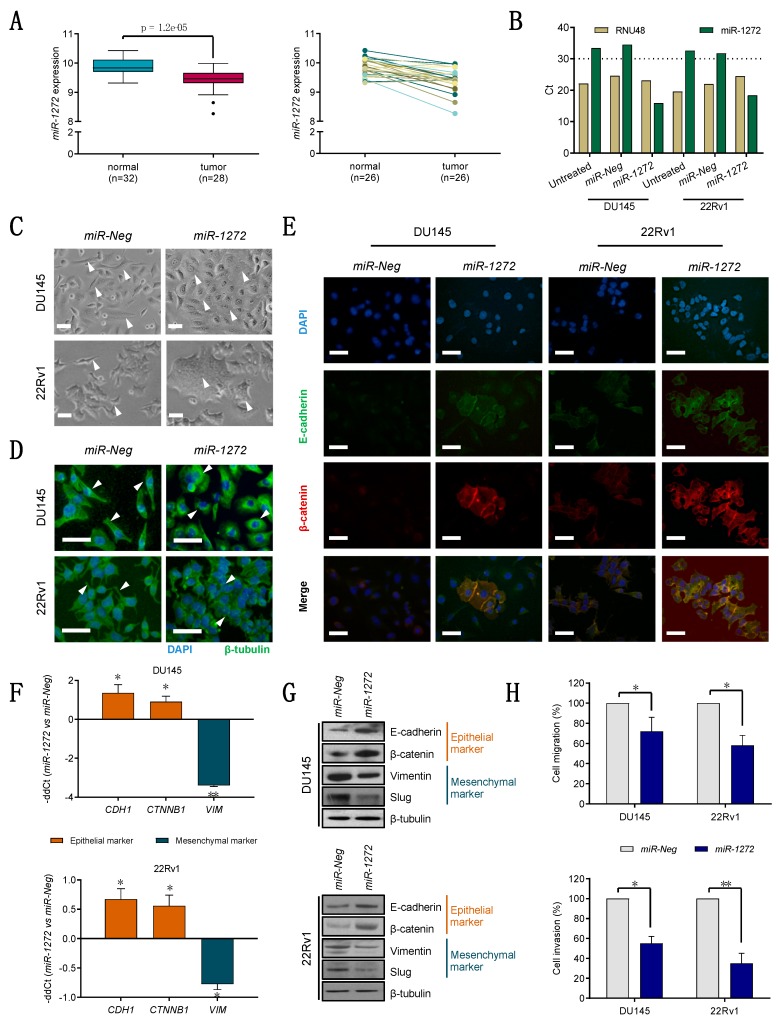
miR-1272 reverts the mesenchymal phenotype and affects migratory and invasive properties of PCa cells. (A) miR-1272 expression in prostate normal and tumor tissue specimens, as from microarray analysis (left). miR-1272 expression in matched normal/tumor pairs is reported (right). (B) Representative RT-qPCR showing the expression levels of endogenous control RNU48 (beige columns) and miR-1272 (green columns) in untreated, miR-Neg and miR-1272 transfected DU145 and 22Rv1 cell lines. Expression values are reported as Cycle threshold (Ct). (C) Representative bright-field microphotographs showing morphological changes occurring in miR-1272 transfected DU145 and 22Rv1 cell lines as compared to miR-Neg cells. Scale bar, 50 μm. (D) Representative immunofluorescence microphotographs showing the organization of β-tubulin cytoskeleton in miR-1272 transfected DU145 and 22Rv1 cell lines as compared to miR-Neg cells. Scale bar, 50 μm. (E) Representative immunofluorescence microphotographs showing E-cadherin (green), β-catenin (red) and their co-localization (yellow merge) at membrane levels in miR-1272 transfected DU145 and 22Rv1 cell lines as compared to miR-Neg cells. Scale bar, 50 μm. (F) RT-qPCR showing the relative expression of epithelial (brick red columns) and mesenchymal (petrol blue columns) markers in miR-1272 transfected DU145 (top) and 22Rv1 (bottom) cells with respect to miR-Neg cells, at day 2 after transfection. Expression values are reported as mean −ddCt (+SD) as from 3 independent experiments, using GAPDH as endogenous control. (G) Immunoblotting showing protein levels of epithelial (brick red) and mesenchymal (petrol blue) markers in miR-1272 transfected DU145 (top) and 22Rv1 (bottom) cells with respect to miR-Neg cells. β-tubulin was used as endogenous control. (H) Bar plots reporting the mean percentage (+ SD) of migrated (top) and invaded (bottom) cells in miR-Neg (used as control) and miR-1272 transfected DU145 and 22Rv1 cell lines, as assessed by transwell assay. The results are reported as percentage of miR-Neg cells and represent the average of 3 independent experiments. * p < 0.05, ** p < 0.01, Student′s t-test.

