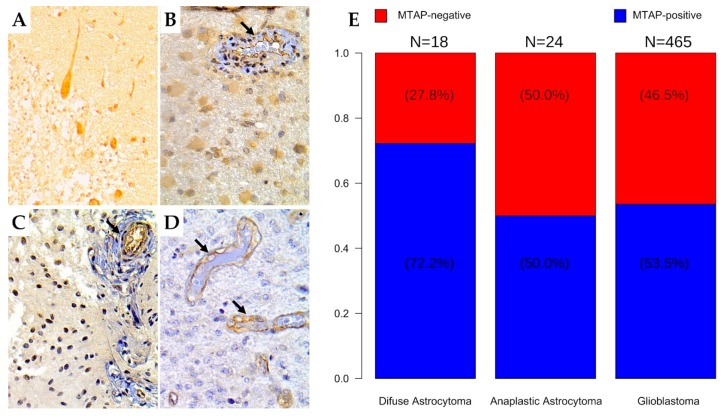
Figure 3.
Immunohistochemistry staining for MTAP in human brain tumor tissues. The human brain tissue slide used for this study contained 507 cases of patients with different grades of gliomas in duplicates. Representative images from (A) normal cerebellum tissue (positive control); (400×) (B) diffuse astrocytoma (grade II); (400×) (C) anaplastic astrocytoma (grade III); 400× (D) glioblastoma (grade IV); 400×. Arrows indicate vessels with endothelial staining for MTAP protein (positive internal control). (E) Frequency of loss of MTAP protein expression in the glioma dataset according to histologic subtype.

