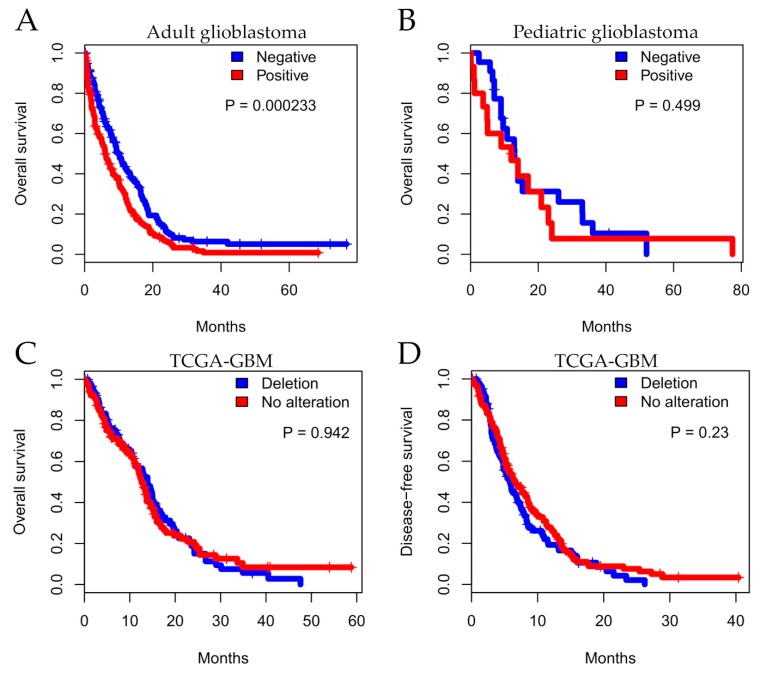
Figure 4.
Kaplan–Meier analysis for MTAP expression associated with patient survival. Overall survival for a series of patients with glioma diagnosis according to histopathological grade. Shown for (A) adult glioblastoma, (B) pediatric glioblastoma, and (C) TCGA-GBM dataset status and (D) five-year disease-free survival (DFS) for TCGA-GBM dataset.

