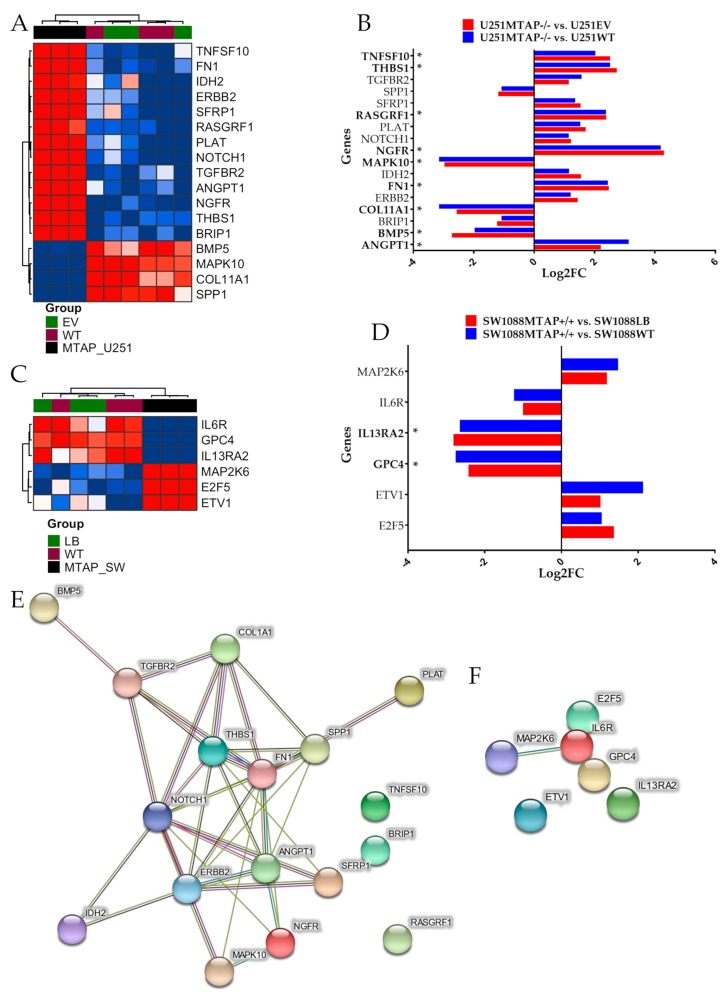
Figure 5.
Detection of differentially expressed genes affected by MTAP gene-edited in glioma cell lines. (A) Heatmap representing the expression profile of the most differentially expressed genes for U251MTAP−/− cell compared to U251EV and U251WT cells. (B) Bar plots showing gene expression as the mean SD of log changes of U251MTAP−/− relative to U251EV and U251WT cells. (C) Heatmap representing the expression profile of the most differentially expressed genes for SW1088MTAP+/+ cell compared to SW1088LB and SW1088WT cells. (D) Bar plots showing the gene expression as the mean SD of log changes of SW1088MTAP+/+ relative to SW1088LB and SW1088WT cells. (E,F) Isolated networks of protein−protein interaction using STRING (http://www.string-db.org). The weight of these lines represents the confidence within which a predicted interaction occurs. Interactions networks for 17 and six proteins differentially regulated in U251MTAP−/− and SW1088MTAP+/+ cells compared to controls U251EV and SW1088LB, respectively. Rows represent genes and columns represent cell lines. Red pixels: upregulated genes; blue pixels: downregulated genes. The intensity of each color denotes the standardized ratio between each value and the average expression of each gene across all samples. Each sphere represents an individual protein, and edges represent protein–protein associations. A red line indicates the presence of fusion evidence; a green line indicates neighborhood evidence; a blue line indicates co-occurrence evidence; a purple line indicates experimental evidence; a yellow line indicates text-mining evidence; a light blue line indicates database evidence; and a black line indicates co-expression evidence. Asterisks (*) labeling the bar indicates a significant difference (p-value < 0.05 and log2FC≥±2) between the gene expression of respective groups and the control. The network nodes represent proteins. Edges represent protein–protein associations. Student t-test: * p < 0.05, ** p < 0.01, *** p < 0.001, ns: not significant

