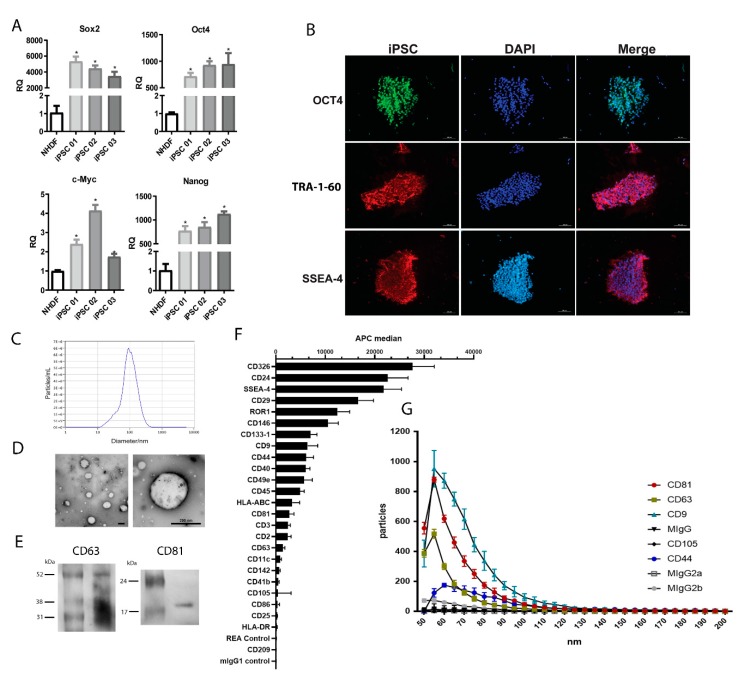
Figure 1.
Characterization of induced pluripotent stem cells (iPSC) and iPSC-derived extracellular vesicles (iPSC-EV). (A) The graph indicates the mRNA level of transcription factors associated with pluripotency SOX2, OCT4, C-MYC, and NANOG in iPSC generated from three different donors (iPSC1, 2, and 3). The ordinate indicates the relative quantification of mRNA levels with respect to normal human dermal fibroblasts (NHDF). The abscissa indicates the cell types. Data represent mean ± SEM ( * indicates statistical difference to the NHDF group, p <0.05 assessed by one-way ANOVA followed by Tukey’s test). (B) Immunofluorescent staining of iPSC for pluripotency markers. The left column shows the positive staining for OCT4 (upper image) in green, TRA-1-60 (central image) in red, and SSEA-4 (lower image) in red. The central column shows the nuclei stained with DAPI in blue. The right column shows the overlap of the two previous respective images. (C) Representative nanoparticle tracking analysis (NTA) of (left) iPSC-EV isolated (white dots) from the culture supernatant. The right image shows the iPSC-EV size distribution and concentration, as indicated in the abscissa (diameter/nm) and in the ordinate (particles/mL). (D) Electron microscopy images of isolated iPSC-EV in different magnifications (scale bars = 200 nm). (E) Representative image of western blot of CD63 and CD81 expression in iPSC-EV. (F) Analysis of iPSC-EV markers with MACSPlex Exosome kit. The graph shows the median fluorescence intensity of each marker, with the background correction. The abscissa indicates the APC fluorescence intensity levels (n = 4). (G) Correlation between size and positivity for exosome markers of iPSC-EV. The graph shows in the ordinate the number of vesicles that are positive for each marker and the abscissa shows the diameter of vesicles. Each condition is indicated on the right according to the symbol (n = 3).

