Figure 2.
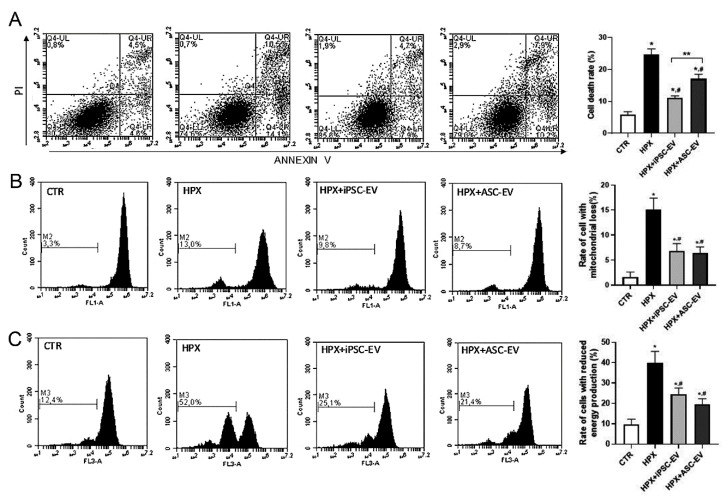
iPSC-EV reduced cell death and mitochondria damage in renal cells submitted to hypoxia-reoxygenation injury. (A) Representative flow cytometry analyses of renal cells stained for annexin V (ANX V)/ propidium (PI) under the different experimental conditions. From left to right panels: CTR (cells cultured in normal condition), HPX (cells submitted hypoxia-reoxygenation injury), HPX+iPSC-EV (cells submitted to injury in the presence of iPSC-EV), and HPX+ASC-EV (cells submitted to injury in the presence of ASC-EV). The graph in the right shows the quantification of flow cytometry analyses in determining the rate of cell death of renal cells in all groups (n = 5). (B) Analyses of alterations in renal cells’ mitochondria mass. The panels are representative flow cytometry analyses of renal cells incubated with the mitochondria fluorescent marker MitoTracker Green FM. The abscissa indicates the distribution of fluorescence intensity given by the respective mitochondria mass in treated cells. The ordinate indicates the number of events analyzed. M2 indicates the percentage of cells with reduced fluorescence intensity and, therefore, reduction in mitochondria mass. The graph in the right shows the percentage of the total cell population that presented a reduction of mitochondria mass, as indicated in the ordinate. The experimental group conditions are indicated in the abscissa (n = 5). (C) Analyses of alterations in renal cells’ mitochondria potential (ΔΨm). The panels are representative flow cytometry analyses of renal cells incubated with the mitochondria fluorescent marker MitoTracker Orange CMTMRos. The abscissa indicates the distribution of fluorescence intensity given by the respective mitochondria with intact ΔΨm. The ordinate indicates the number of events analyzed. M3 indicates the percentage of cells with reduced fluorescence intensity and, therefore, reduction in mitochondrial ΔΨm. The graph in the right shows the percentage of the total cell population that presented a reduction of mitochondria mass with intact ΔΨm, as indicated in the ordinate. The experimental group conditions are indicated in the abscissa (n = 5). Data represent mean ± SEM (* indicates statistical difference to CTR group; # indicates statistical difference to HPX group; ** indicates statistical difference to HPX+iPSC-EV group; p <0.05 assessed by one-way ANOVA followed by Tukey’s test).

