Figure 3.
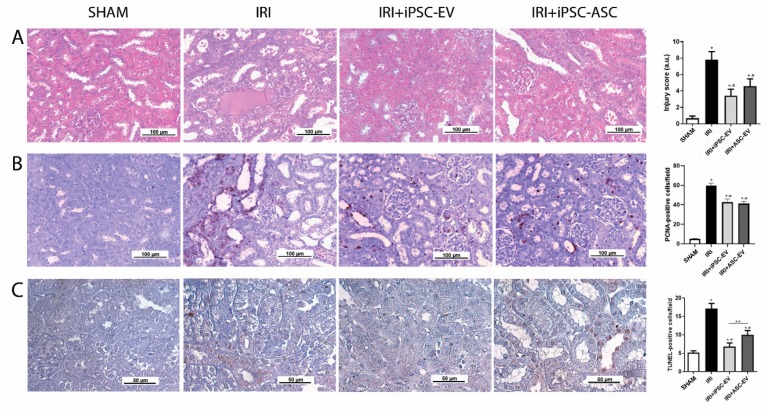
Subcapsular injection of iPSC-EV promoted the protection of renal tissue against ischemia-reperfusion injury (IRI). (A) Representative photomicrographs show the kidney cortical sections stained with hematoxylin/eosin (H/E) in the different experimental conditions (scale bar = 100 µm). From the left image to the right: SHAM indicates false-operated animals; IRI represents the animals submitted to ischemia-reperfusion injury by the bilateral renal arterial clamping; IRI+iPSC-EV indicates the animals submitted to renal ischemia and that received subcapsular injection of iPSC-EV into the kidney just after the clamp release; IRI+ASC-EV indicates the animals submitted to renal ischemia and that received subcapsular injection of ASC-EV into the kidney just after the clamp release. The graph shows the score of tubular lesions in each condition. SHAM, n (kidneys) = 4; IRI, n (kidneys) = 8; IRI+iPSC-EV, n (kidneys) = 16; IRI+ASC-EV, n (kidneys) = 6. (B) Representative photomicrographs of immunohistochemistry for PCNA (scale bar = 100 µm). The graph in the right shows the quantification of the number of PCNA-positive cells per field from immunohistochemistry. SHAM, n = 10 fields for 6 kidneys; IRI, n = 10 fields for 7 kidneys; IRI+iPSC-EV, n = 10 fields for 16 kidneys; IRI+ASC-EV, n = 10 fields for 6 kidneys. (C) Representative photomicrographs of immunohistochemistry for TUNEL (scale bar = 50 µm). The graph in the right shows the quantification of the number of TUNEL-positive cells per field from immunohistochemistry. SHAM, n = 10 fields for 6 kidneys; IRI, n = 10 fields for 7 kidneys; IRI+iPSC-EV, n = 10 fields for 16 kidneys; IRI+ASC-EV, n = 10 fields for 6 kidneys. Data represent mean ± SEM (* indicates statistical difference to SHAM group; # indicates statistical difference to IRI group; ** indicates statistical difference to IRI+iPSC-EV group; p <0.05 assessed by one-way ANOVA followed by Tukey’s test).

