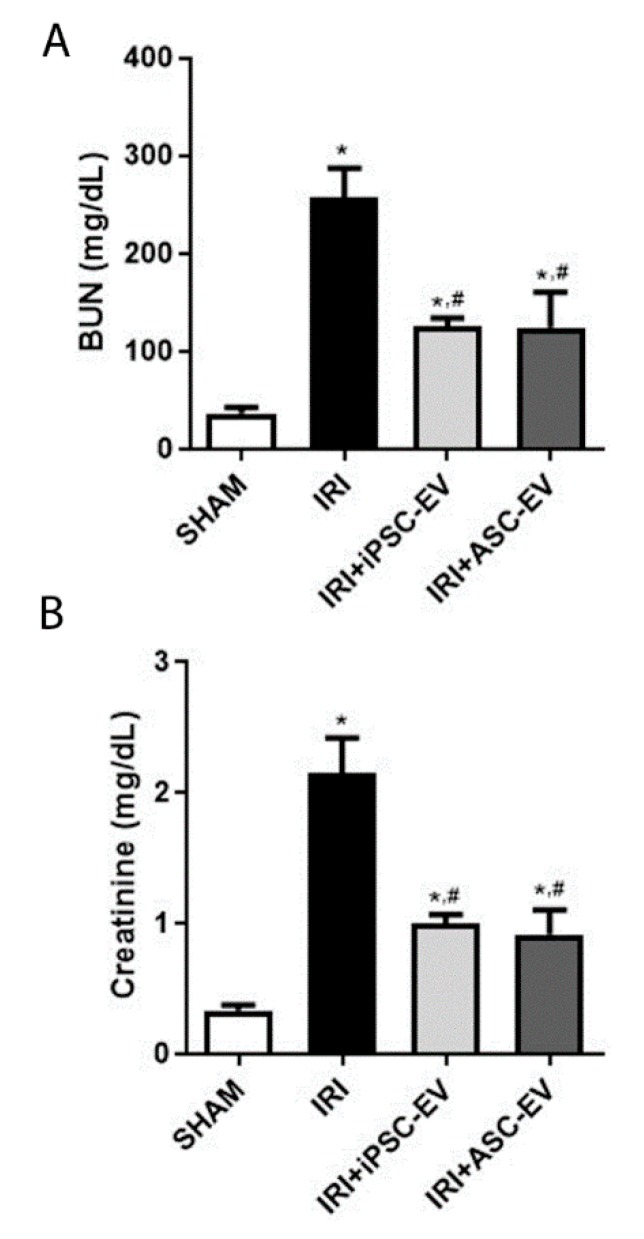
Figure 4.
Administration of iPSC-EV after ischemia promoted the protection of kidney function. (A) Measurement of blood urea nitrogen (BUN) levels of the animals submitted to the different experimental conditions. The abscissa indicates each experimental groups: SHAM, IRI, IRI+iPSC-EV, and IRI+ASC-EV. The ordinate indicates the concentration of BUN (mg/dL). (B) Measurement of creatinine levels in the blood of the animals submitted to the different experimental conditions, as indicated in the abscissa. The ordinate indicates the creatinine concentration in the blood (mg/dL). In both analyses, SHAM, n = 4; IRI, n = 5; IRI+iPSC-EV, n = 11; IRI+ASC-EV, n = 5. Data represent mean ± SEM (* indicates statistical difference to SHAM group; # indicates statistical difference to IRI group; p <0.05 assessed by one-way ANOVA followed by Tukey’s test).

