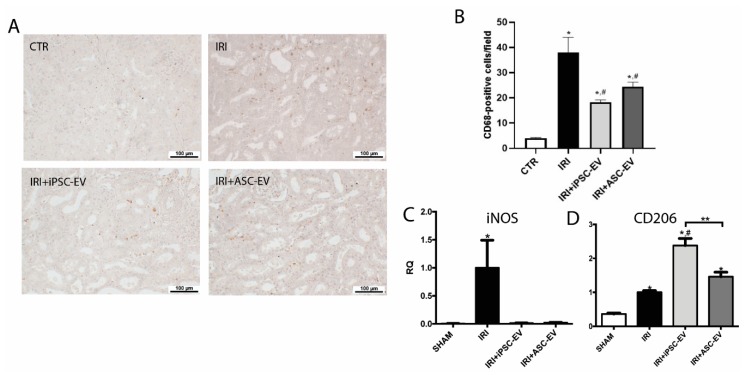
Figure 5.
iPSC-EV promoted the reduction of the inflammatory response induced by IRI. (A) Representative photomicrographs of the renal tissue stained for ED-1 by immunohistochemistry. From the left image to the right: SHAM, IRI, IRI+iPSC-EV, and IRI+ASC-EV (scale bars = 100 µm). (B) Quantification of the number of CD68-positive cells/field. SHAM, n = 10 fields for 4 kidneys; IRI, n = 10 fields for 5 kidneys; IRI+iPSC-EV, n = 10 fields for 8 kidneys; IRI+ASC-EV, n = 10 fields for 4 kidneys. (C) mRNA levels of iNOS and (D) CD206 in renal tissue expressed as relative quantification (RQ) with respect to the IRI group (SHAM, n = 3; IRI, n = 3; IRI+iPSC-EV, n = 5; IRI+ASC-EV, n = 3). Data represent mean ± SEM (* indicates statistical difference to SHAM group; # indicates statistical difference to IRI group; ** indicates statistical difference to IRI+iPSC-EV group; p <0.05 assessed by one-way ANOVA followed by Tukey’s test).

