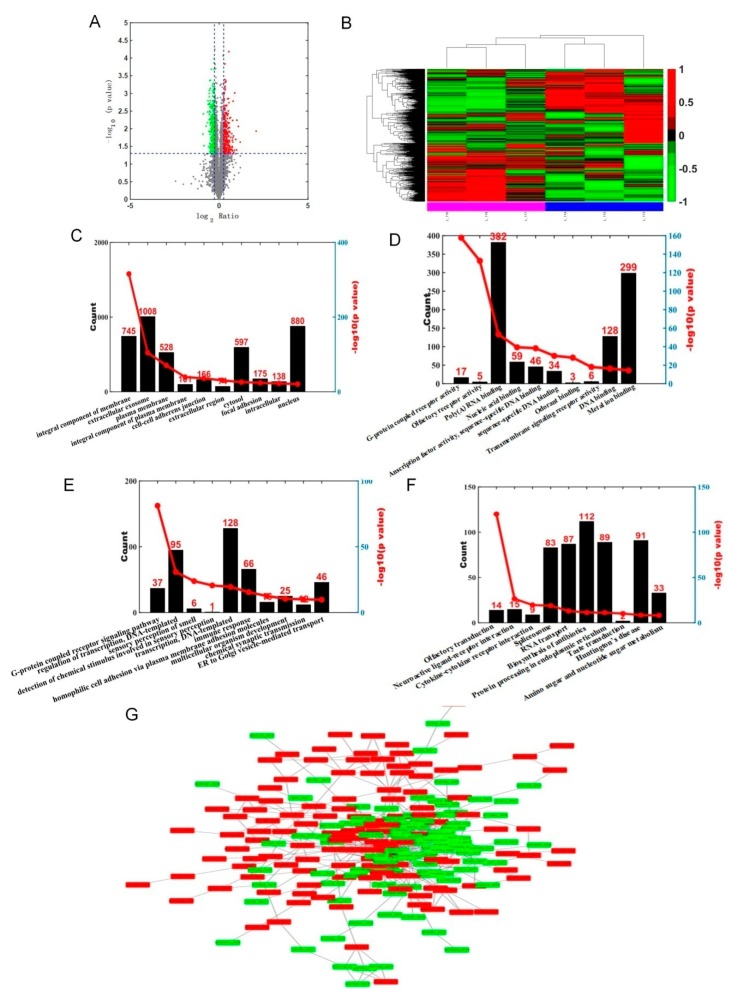
Figure 1.
Differentially expressed proteins in silicosis rat lung tissue and bioinformatic analysis. (A): Red dots represent upregulated proteins, green dots are downregulated proteins; change was 1.2 fold, p value < 0.05 indicated significant difference. (B): Each row represents the expression levels of each protein in different samples, and the columns represent the expression levels of all proteins in each sample. The colors indicate the expression levels of the proteins. The larger the expression level, the darker the color (red is upregulated, green is downregulated). The tree chart above shows the clustering analysis results of different samples from different experimental groups, and the tree chart on the left shows the clustering analysis results of different proteins from different samples. (C): Cellular component analysis (GO-C). (D): Molecular function analysis (GO-F). (E): Biological process analysis (GO-P). (F): Kyoto Encyclopedia of Genes and Genomes analysis (KEGG). (G): Protein-protein interaction (PPI) network.

