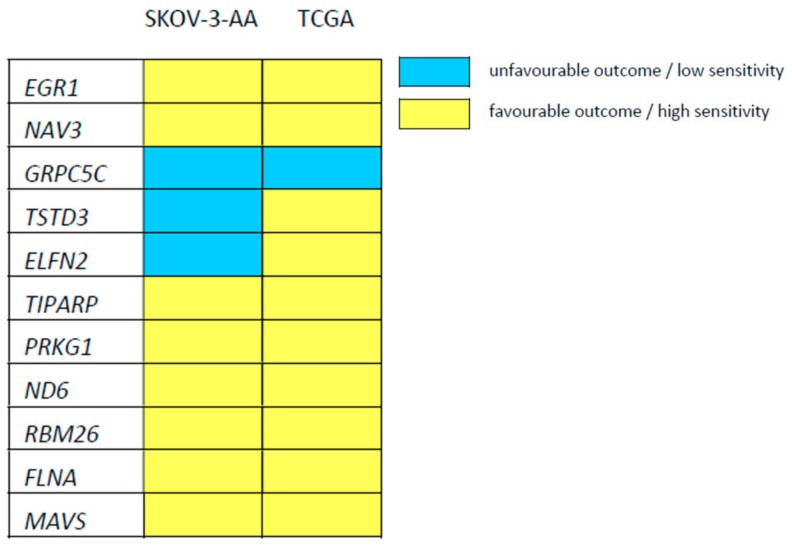
Figure 4.
Heatmap indicating the relationship between low expression of the indicated genes and sensitivity/outcome, favourable (low cisplatin EC50 in SKOV-3-AA cells or prolonged survival of cisplatin-treated patients, indicated in yellow) or unfavourable (high cisplatin EC50 in SKOV-3-AA cells or reduced survival of cisplatin-treated patients, indicated in blue), based on the comparison of gene expression between SKOV-3-AA and EV- or PEA-15DD-transfected variants and TCGA data.

