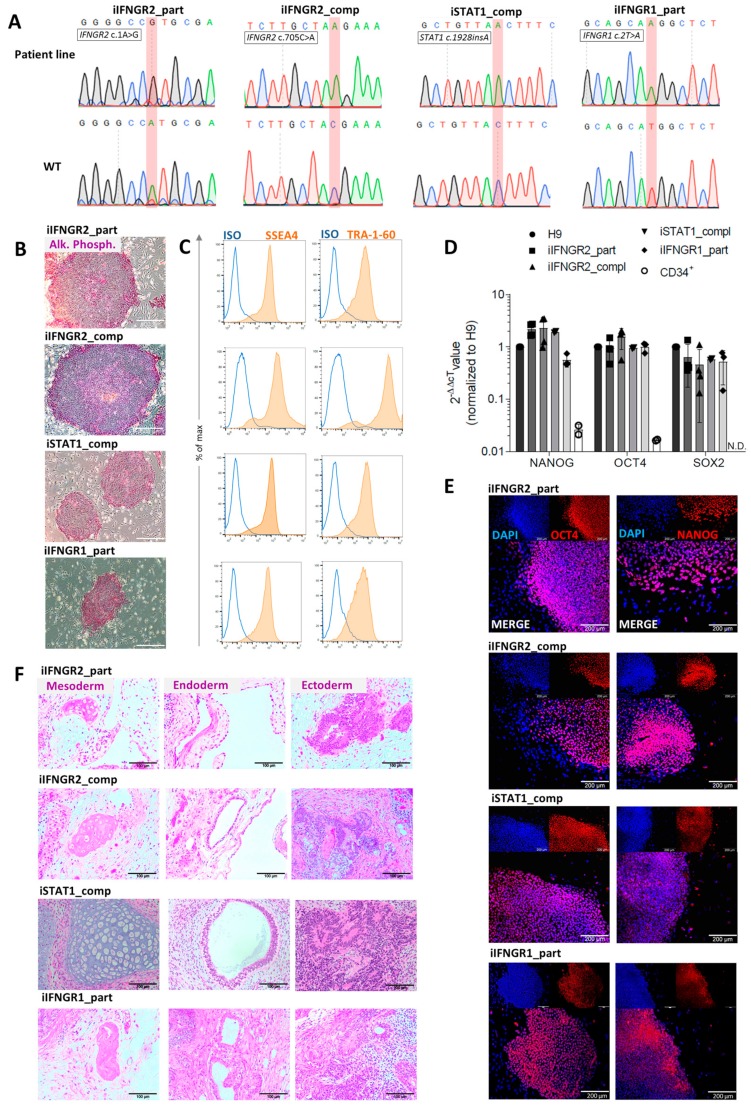
Figure 2.
Characterization of patient specific iPSCs. (A) Sequence and electropherogram for the patient-specific mutation. Sequencing was performed on the patient line (top) and a healthy iPSC line (bottom) as wild type (WT) control. The mutated nucleotide or insertion is highlighted in red. (B) Staining for alkaline phosphatase (AP) activity of patient iPSCs. Scale bar = 200 µm. (C) Representative flow cytometric analysis of SSEA4 (left) and TRA-1-60 (right) expression on patient iPSCs. Blue: Isotype. Orange: Marker. (D) qRT-PCR analysis of endogenous NANOG, OCT4 and SOX2 expression of patient iPSCs normalized to H9 control cells. ACTIN was used as a housekeeping gene and CD34+ cells as negative control. N.D. = not detectable (n = 3 biological replicates, mean ± SD). (E) Representative images of cells of the three germ layers after teratoma formation after injection of patient iPSCs into immunodeficient mice. Scale bar = 100 µm. (F) Representative immunofluorescent staining for OCT4 (left) and NANOG (right) in patient iPSCs co-stained with DAPI. Scale bar = 200 µm.

