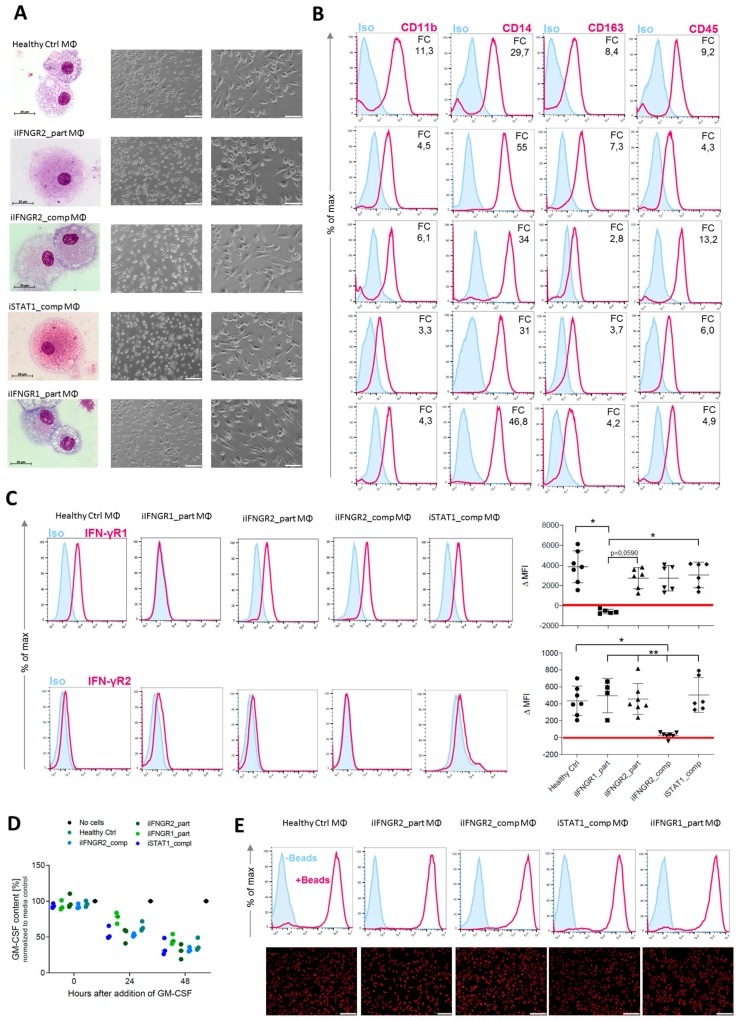
Figure 3.
Generation of patient specific iPSC-derived macrophages. Patient iPSCs have been differentiated into macrophages and compared to macrophages from a healthy iPSC line (hCD34_iPSC16). (A) Microscopic analysis of patient iPSCs in cytospin images after Pappenheim staining (left, scale bar = 20 µm) or in brightfield images (middle scale bar 200 µm, right scale bar = 100 µm). (B) Representative flow cytometric analysis of CD11b, CD14, CD163 and CD45 expression on patient iPSCs and healthy macrophages of two independent experiments. Blue: Isotype. Pink: Surface marker. FC = fold change of the median fluorescent intensity. (C) Flow cytometric analysis of IFN-γR1 (top) and IFN-γR2 (bottom) expression on healthy and patient iPSC-derived macrophages. Blue: Isotype. Pink: Surface marker. Expression has been quantified by plotting the difference of the median fluorescent intensity (ΔMFI). Each dot represents macrophages from an independent harvest and from at least three independent differentiations (n = 4–7, mean ± SD, Kruskal–Wallis with Dunn’s multiple comparison). Red line shows ΔMFI of 0. (D) GM-CSF clearance of healthy and patient iPSC-derived macrophages over a time of 48 h. Concentrations have been normalized to control well containing no cells (media only) (n = 3, mean ± SD; each dot represents macrophages from an independent harvest and from at least three independent differentiations). (E) Representative flow cytometric (top) and microscopic (bottom) analysis of phagocytic uptake of pH-sensitive fluorescent labeled E. coli bioparticles of healthy and patient iPSC-derived macrophages of two independent experiments; scale bar = 500 µm.

