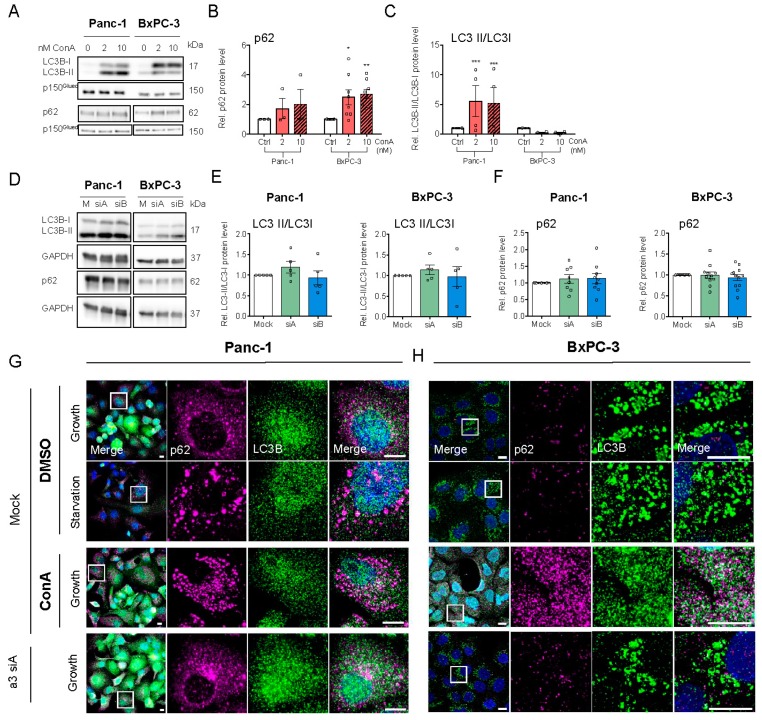
Figure 5.
V-ATPase inhibition alters autophagic flux and a similar trend is seen after a3 KD. Panc-1 and BxPC-3 cells were treated with either DMSO ctrl., 2 or 10 nM ConA for 48 h (A–C), or were transfected with Mock siRNA or 2 different siRNAs targeting a3, and grown for 48 h (D–F), followed by lysing and Western blot analysis. (A,D) shows representative blots of LC3B and p62 in cells either treated with ConA (n = 3–7) (A) or transfected with siRNA against a3 (n = 3–12) (D). (B,C,E,F) show densitometric quantification of the protein levels of p62 (B,F) and LC3II/LCI (C,E). Data were normalized to respective loading ctrl. (p150Glued or GAPDH) and the level in respective DMSO or mock ctrl. Data are shown as mean with S.E.M. error bars, of 3 to 12 independent experiments per cell line. * p < 0.05, ** p < 0.01, and *** p < 0.001: Significantly different from the level in control conditions (mock siRNA), using one-way ANOVA and Dunnett’s post hoc test. Rel. = relative. (G,H) Panc-1 and BxPC-3 cells were transfected with mock siRNA or siRNA targeting a3 and were simultaneously treated with either DMSO or 10 nM ConA, and were subjected to either growth or starvation conditions for 48 h. The cells were subsequently subjected to immunofluorescence analysis of LC3B (green) and p62 (magenta). Nuclei were stained with DAPI. Scalebar = 10 µm. Images represent 4 (Panc-1) and 5 (BxPC-3) independent experiments.

