Figure 4.
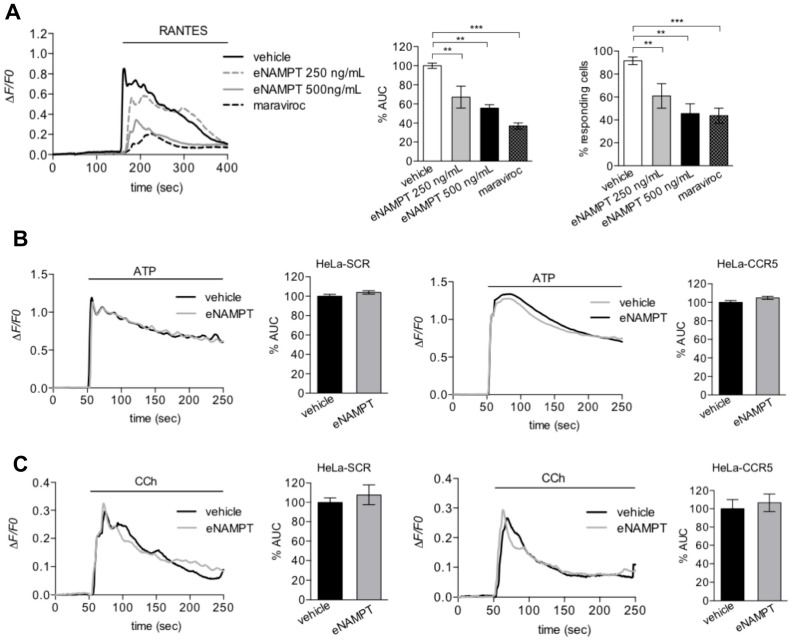
eNAMPT inhibits Rantes-induced cytosolic Ca2+-signals. (A) Representative calcium traces of HeLa-CCR5 loaded with FURA-2AM and treated with vehicle, eNAMPT (250 ng/mL; 4.5 nM or 500 ng/mL = 9 nM), or maraviroc (10 µM) 100 s before the addition of 25 ng/mL (3 nM) of Rantes. Histograms of responding cells (middle panel) and percentage of Area Under the Curve ( AUC )(right panel) as mean ± S.E.M. (248–410 cells from 6–11 independent experiments). (B,C) Representative calcium traces and percentage of AUC of HeLa-SCR and HeLa-CCR5 loaded with FURA-2AM and treated with 3 µM of ATP (B) or 300 µM of CCh (C) alone or pretreated with eNAMPT (500 ng/mL = 9 nM) for 5 min. The data are summarized in histograms and expressed as mean ± S.E.M of 120–190 cells (from 5–9 independent experiments) and 105–185 cells (from 5–9 independent experiments), respectively. ** p < 0.01 *** p < 0.001.

