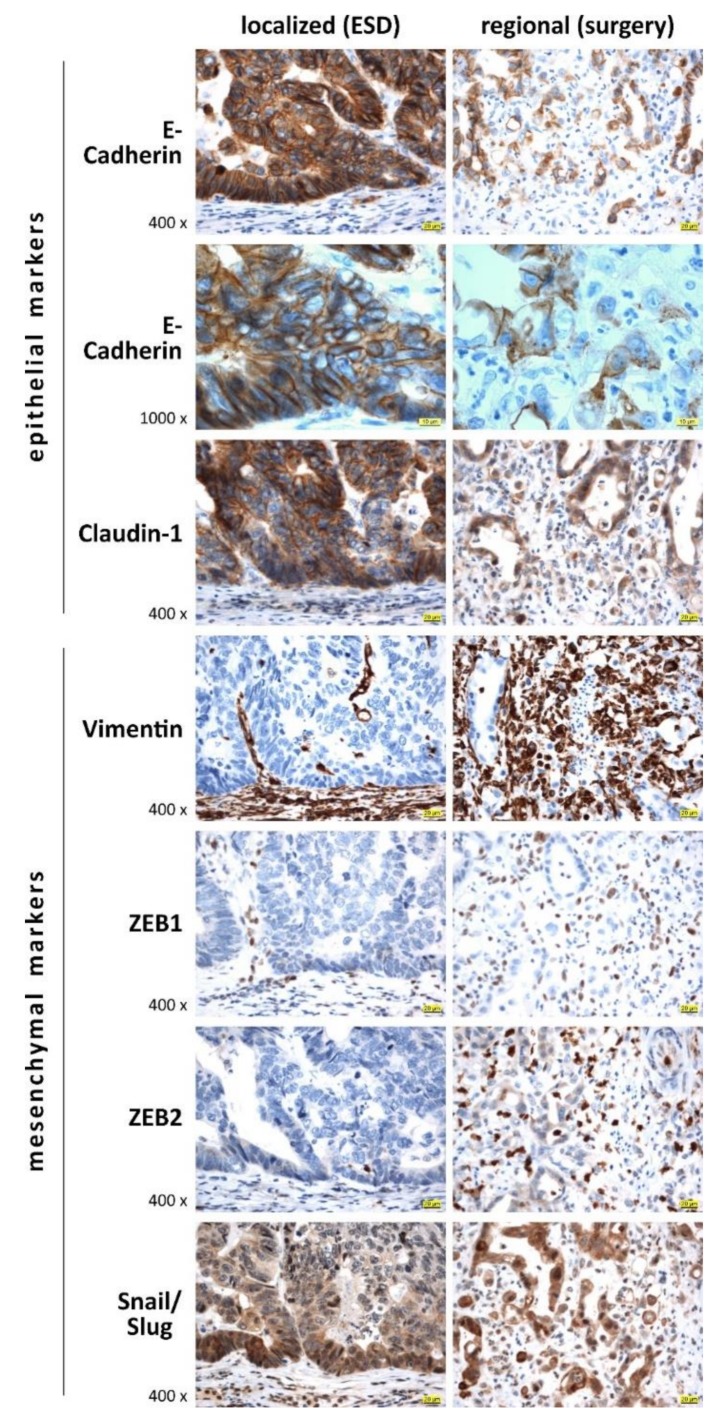
Figure 2.
Representative IHC staining images of epithelial-to-mesenchymal transition (EMT) markers for selected localized (ESD-resected, (pT1, pN0) and regional (surgically resected (p > T1, pN1) cases of esophageal adenocarcinoma. For semiquantitative analysis of IHC staining, see Figure 3. Scale bar (yellow) indicates 20 or 10 μm for 400× and 1000× magnification, respectively.

