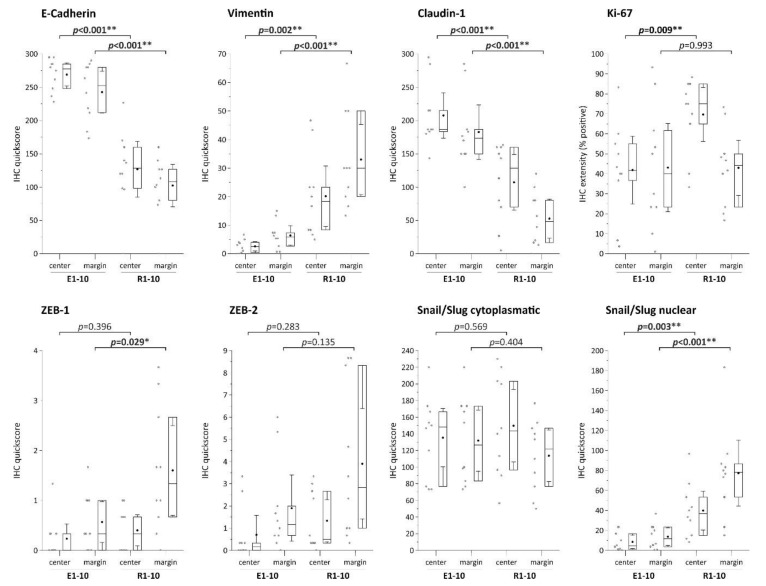
Figure 3.
Semi-quantitative analyses of IHC staining of EMT markers using quickscore [29]. Box plots show the 25th and 75th percentiles, median (horizontal line), mean (filled circle), and 95% confidence interval (whiskers). For representative images of IHC staining, see Figure 2. * indicates significance (p < 0.05), ** indicates high significance (p < 0.01).

