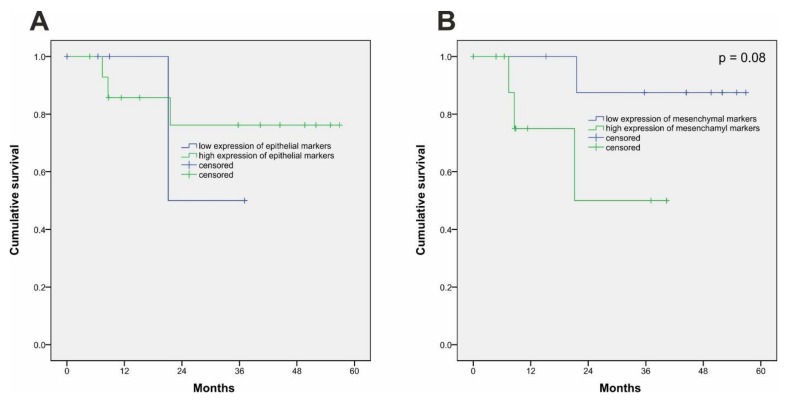
Figure 7.
Selective survival analysis using epithelial (A) and mesenchymal (B) markers. Selection of epithelial and mesenchymal markers as well as the respective cut-off values to determine high/low cases was done based on K-means cluster analysis (Table 3). Selected epithelial markers include E-cadherin IHC score center/margin, claudin-1 IHC score center/margin, and miR-205 expression. Selected mesenchymal markers include vimentin IHC score center/margin, ZEB1 IHC score center, and nuclear Snail/Slug IHC score center/margin.

