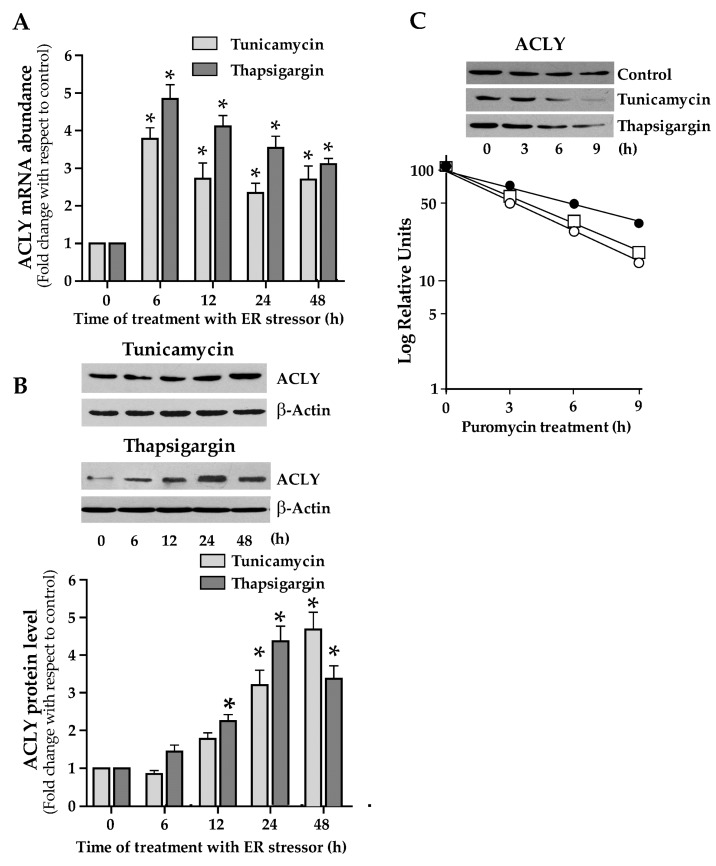
Figure 5.
ACLY expression in endoplasmic reticulum (ER)-stressed cells. (A) HepG2 cells were incubated in the presence of 1 μg/mL tunicamycin or 300 nM thapsigargin for the indicated times. Cells were then harvested, and total RNA was extracted. ACLY mRNA levels, normalized with 18S rRNA, were reported in histograms as fold change relative to the untreated control cells. Values are means ± S.D., n = 5. (0 h vs. 6 h, 12 h, 24 h, and 48 h * p ≤ 0.05). (B) Proteins (60 μg) were prepared from ER-stressed cells, separated by SDS/PAGE and immunoblotted with the antibody against ACLY. The content of ACLY was analyzed by Western blotting, quantified by densitometric analysis, and was expressed as fold change relative to ACLY content in untreated control cells. Values are means ± S.D., n = 4 (0 h vs. 24 h and 48 h, * p ≤ 0.05). (C) HepG2 cells, incubated in DMEM with 1 μg/mL tunicamycin or 300 nM thapsigargin for 24h, were then treated with 2 μg/mL puromycin. At different times, cells were harvested and the content of ACLY protein was measured by Western blot analysis. The semilog plot represents the decay curve of ACLY protein in control (filled circle), in tunicamycin- (open circle) and thapsigargin-treated (open square) HepG2 cells. The results are from a representative experiment, with similar results being obtained in three independent experiments.

