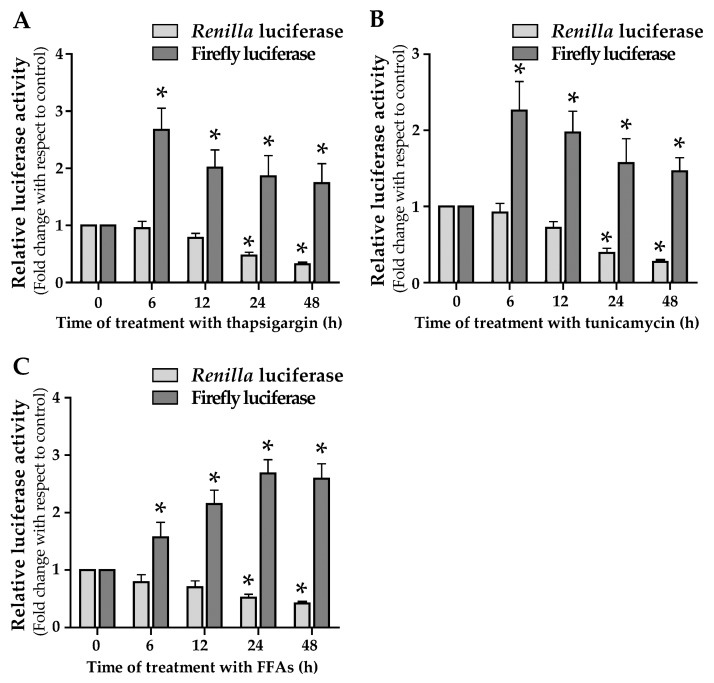
Figure 6.
IRES activity is stimulated in ER-stressed cells or in cells under treatment with FFAs. (A,B) HepG2 cells were co-transfected with the reporter plasmid pR-ACLY-F and with the control plasmid pCMV-SPORT-β-gal. After 24 h, cells were treated with thapsigargin (A) or tunicamycin (B) for the indicated times and then RL and FL luciferase activities were measured. For each sample, values were reported in histograms as fold change with respect to control, represented by untreated transfected cells. Values are means ± S.D., n = 6 (0 h vs. 6 h, 12 h, 24 h, and 48 h * p ≤ 0.05). (C) HepG2 cells were transiently transfected with pR-ACLY-F. After transfection, cells were incubated in the presence or in the absence of 0.75 mM FFAs. Luciferase activity measured in cells treated with FFAs is reported as fold change with respect to that determined in untreated transfected cells. Values are means ± S.D., n = 6 (0 h vs. 6 h, 12 h, 24 h, and 48 h * p ≤ 0.05).

