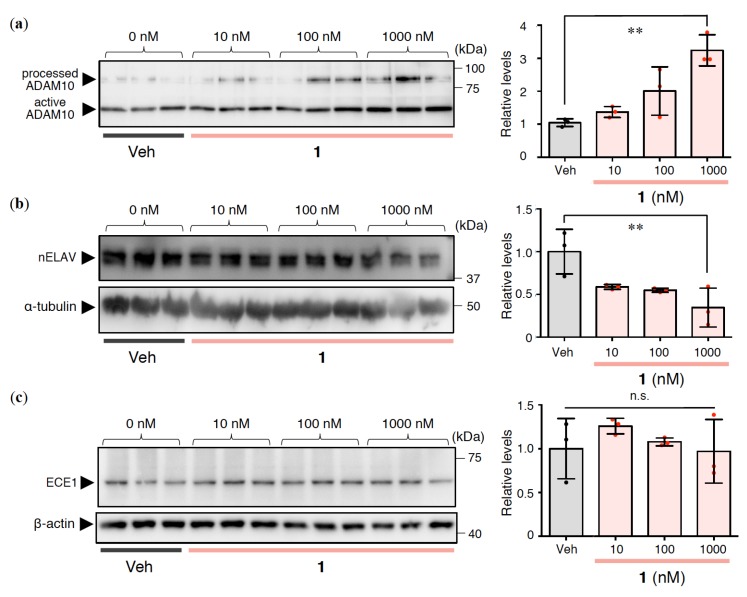
Figure 3.
(a) Processed ADAM10, (b) nELAV, and (c) ECE1 in the cell lysate prepared from rat primary cerebral cortex cells treated with 1 at indicated concentrations for 24 h. The relative levels of (a) active ADAM10, (b) α-tubulin, and (c) β-actin are presented as mean ± SD (n = 3). **p < 0.01 versus Veh (vehicle). n.s.: not significant. Red or black dots represent each value.

