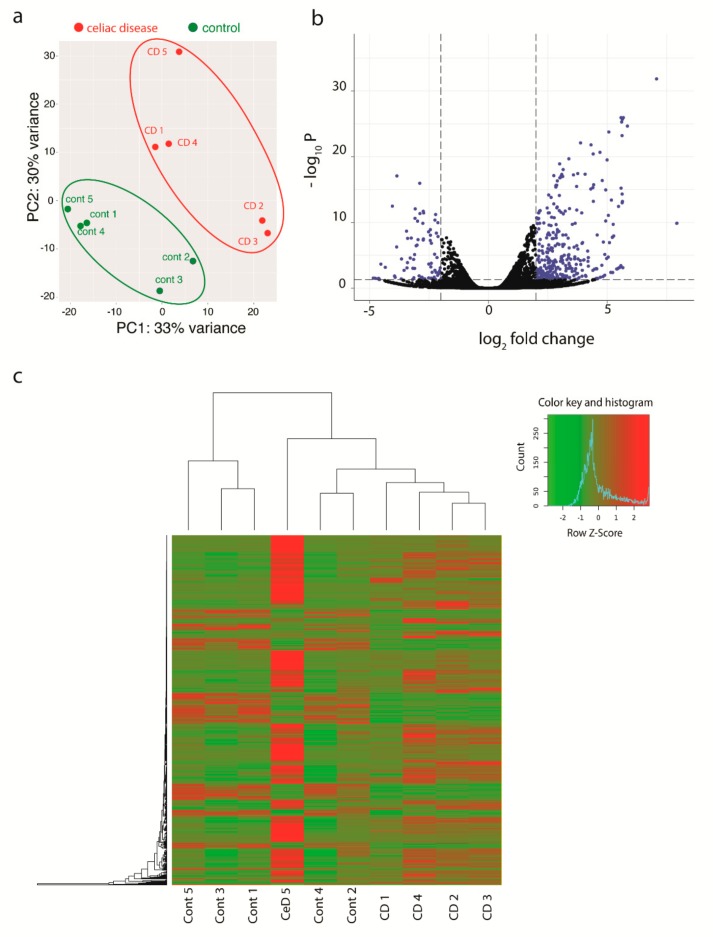
Figure 1.
Multivariate visualization of the analyzed genes. (a) PCA scatter plot PCA plot showing variance between CD patients’ samples and non-celiac control samples (PC1), and heterogeneity between the five biological replicates in each group (PC2). (b) Volcano plot representing the results of the analysis. Each dot representing one gene, and the blue highlighted genes were significantly differentially expressed (p-value < 0.05) and log fold change cut-off 2. (c) Heatmap shows hierarchical clustering of genes on the left side and the clustering of the samples on the top. The histogram represents the expression data of the significant differentially expressed genes (green is the down-regulated and red is the up-regulated).

