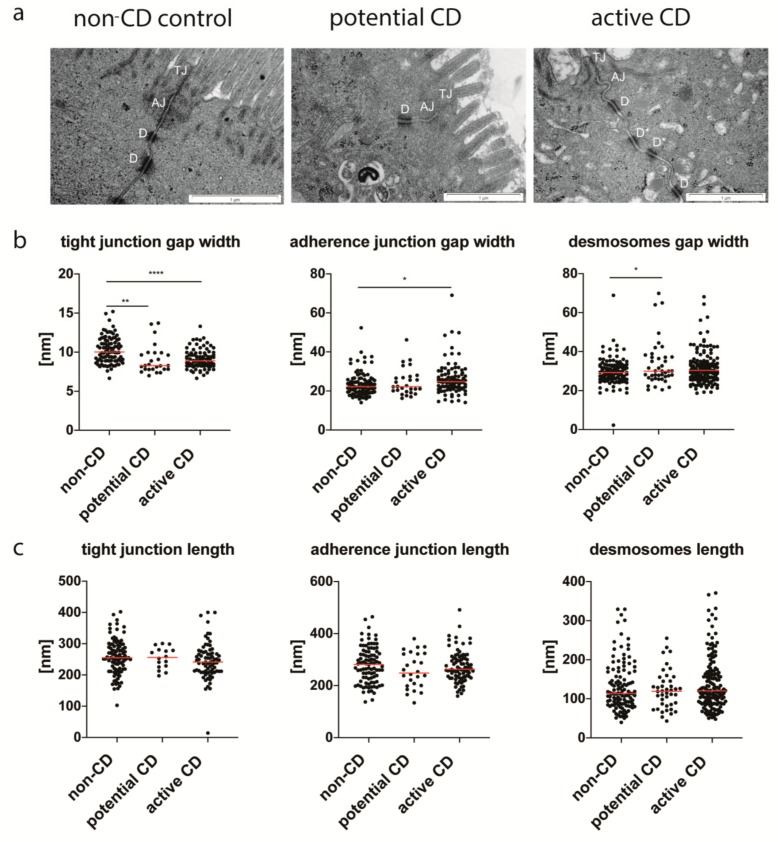
Figure 4.
The proximal region of the enterocytes with tight junctions (TJ), adherence junctions (AJ) and desmosomes (D) from the non-CD control group, patients with potential and active CD (a), and ultrastructural features of intercellular junctions (b,c). Desmosomes with an incorrect asymmetrical structure (D*) present in a patient with active CD. The widths (b) and lengths (c) of EJC were measured using the morphometric iTEM program (Olympus) at a magnification of ×60,000. Measurements were done in 10 selected epithelial areas through longitudinally sectioned intercellular junctions, and at least 5 values of each type of junction/patient were obtained. All measurements are presented. Statistical analysis was performed with the use of one-way ANOVA with Tukey correction for multiple comparisons. * p < 0.05, ** p ≤ 0.01, **** p ≤ 0.0001.

