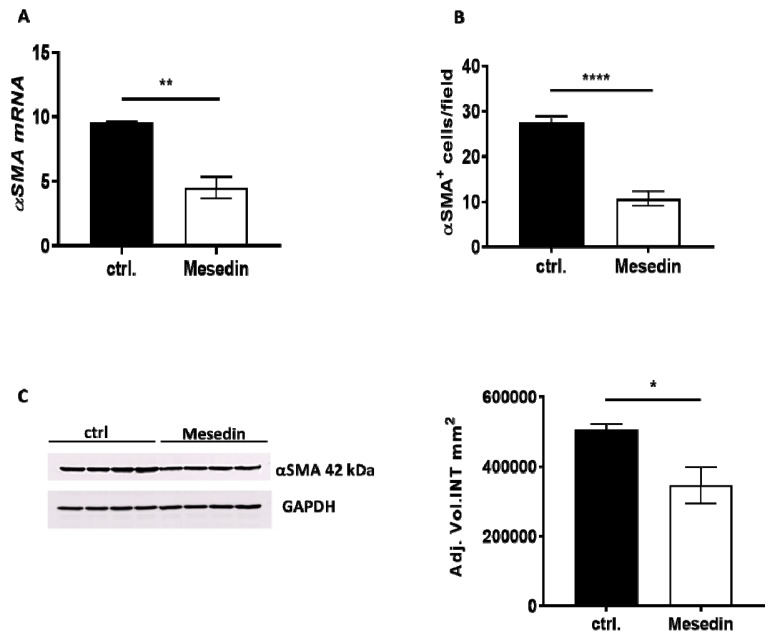
Figure 4.
Influence of mesedin on α-smooth muscle actin (α-SMA) expression in M1-4HSCs. (A) Quantification of α-SMA mRNA in mesedin-treated M1-4HSCs vs controls (ctrl.), n = 6. (B) Quantification of α-SMA+ M1-4HSCs with and without mesedin, n = 5. (C) Western blot and densitometric analysis of α-SMA in M1-4HSCs treated with mesedin, n = 4. Student’s t-test; data are shown as the mean ± SEM, p < 0.05 (*), p < 0.01 (**), p < 0.0001 (****).

