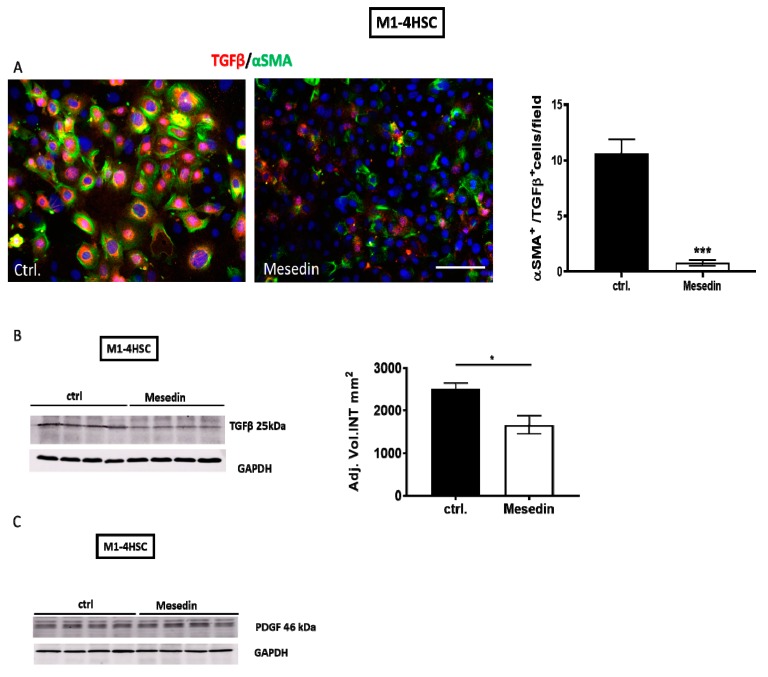
Figure 5.
Transforming growth factor-β (TGF-β) and platelet-derived growth factor (PDGF) expression in mesedin-treated M1-4HSCs. (A) TGF-β (red) and α-SMA (green) staining of M1-4HSCs under control conditions (ctrl.) and incubation with mesedin. Cell nuclei were stained with DAPI; scale bar 100 µm. Quantification of α-SMA/TGF-β-positive M1-4HSCs (n = 9, p < 0.001 (***), Student’s t-test; data shown as the mean ± SEM). (B) TGF-β expression as analyzed by Western blot and a corresponding densitometric analysis of M1-4HSCs treated with mesedin vs the control (ctrl.) (n = 4, p < 0.05 (*), Student’s t-test, data shown as the mean ± SEM). (C) PDGF Western blot of M1-4HSCs with and without mesedin (ctrl.), n = 4.

