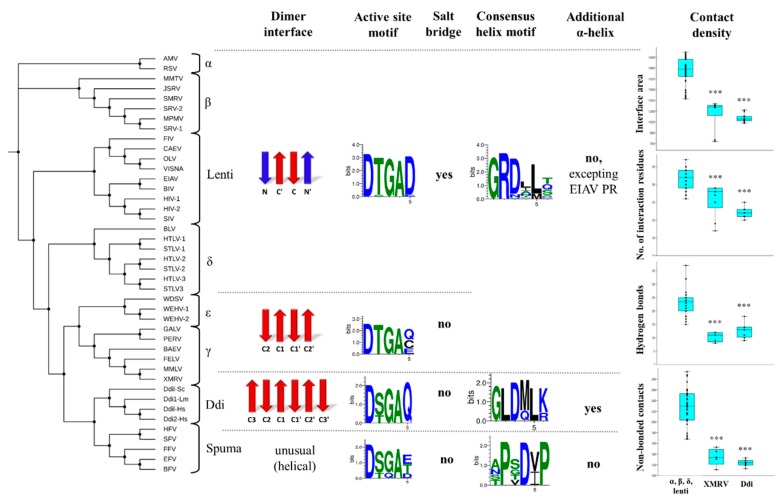
Figure 8.
Correlation of structural characteristics with evolutionary relationships. The phylogenetic tree was obtained via multiple alignment of the protease sequences. The names of retroviruses are defined in the list of abbreviations. The features that were characteristic of the different groups are shown horizontally (separated by dashed lines). For dimer interfaces, N- and C-terminal β-strands are indicated in red and blue, respectively. Sequence logos were prepared on the basis of protease sequences of the different groups. The possible occurrence of a salt bridge formed by the fifth residue of active site motif is also shown. The presence of additional α-helical inserts is shown, the 310-helices are not presented in the figure. For comparisons of contact maps, the values are shown based on the PDBsum database for (i) lentivirus, alpha-, beta- and deltaretrovirus PRs, (ii) XMRV PR, and (iii) Ddi proteases. *** denotes statistically significant difference (p < 0.001) as compared to the group of lentivirus, alpha-, beta- and deltaretrovirus PRs, determined by using PAST v3.26 software.

