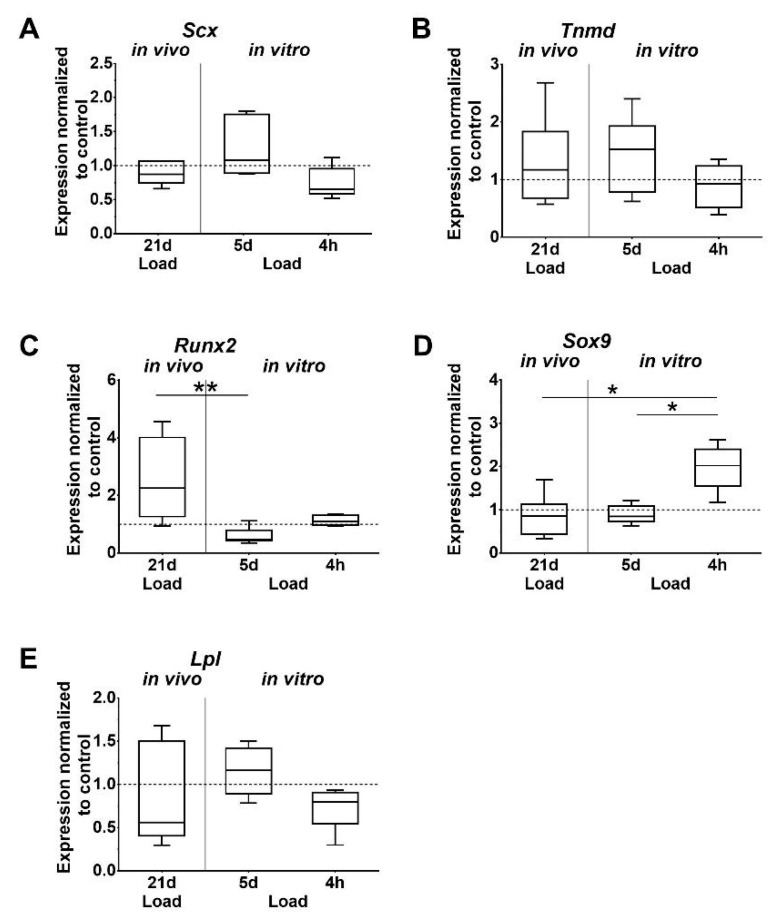
Figure 3.
Differential expression of tissue-specific markers. (A,B) Tenogenic, (C–E) osteogenic, chondrogenic, and adipogenic markers. Gene expression is given as fold change to non-loaded controls (horizontal line). Inter-group differences are marked with an asterisk (* p < 0.05, ** p < 0.01, n = 6).

