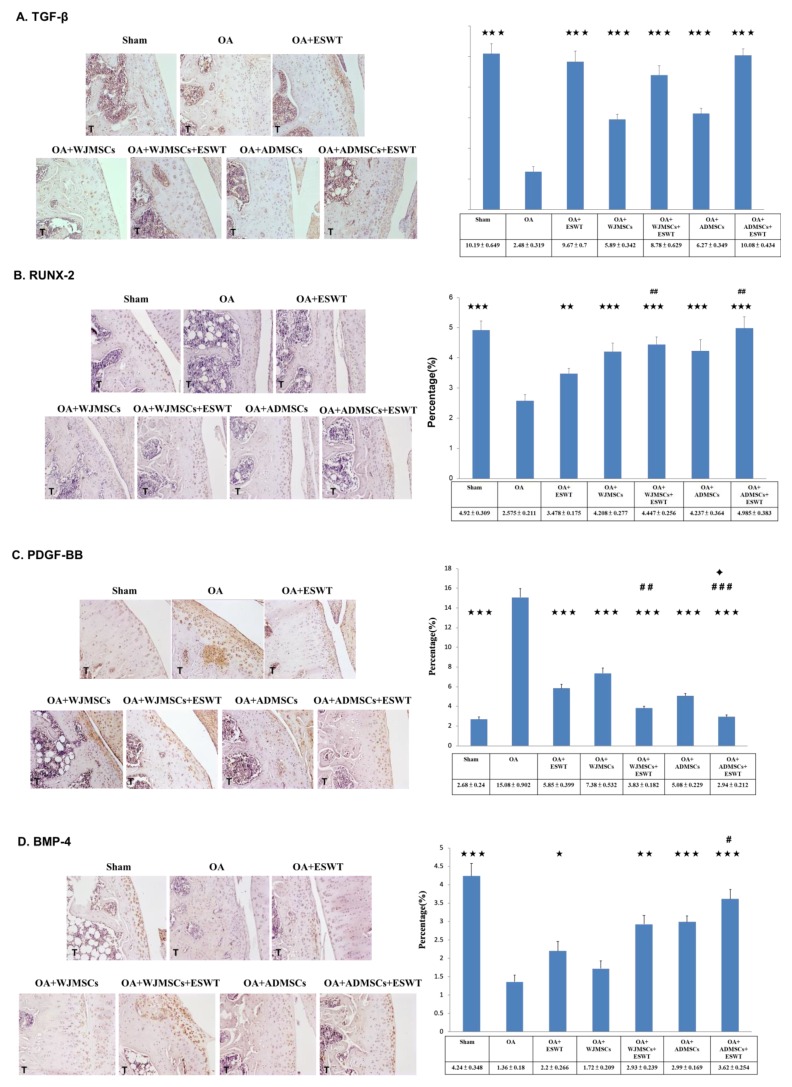
Figure 5.
Immunohistochemical analysis for cartilage development-specific markers. (A) TGF-β (×200 magnification), (B) RUNX-2 (×200 magnification), (C) PDGF-BB (×200 magnification), and (D) BMP-4 in the experiments (×200 magnification) (left), and levels of expression measured after treatment (right). * p < 0.05, ** p < 0.01, and *** p < 0.001 were compared with OA; # p < 0.05, ## p < 0.01, and ### p < 0.001 were compared among treatment groups. ✦ p < 0.05 was compared between ESWT and combined ADMSCs or WJMSCs. n = 6 for all groups. T indicates the tibia.

