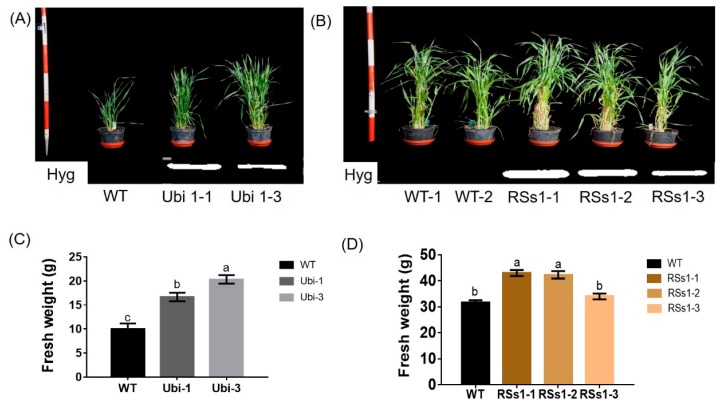
Figure 2.
Phenotypes of all barley plants in pot experiments during the vegetative growth stage. (A) The phenotypes and (C) fresh weight of WT and Ubi-1/2/3 transgenic lines. (B) The phenotypes and (D) fresh weight of WT and RSs1-1/2/3 transgenic lines. Different letters indicate a significant difference between overexpression transgenic lines and WT (p < 0.05, one-way ANOVA). Error bars: standard error (n = 4 plants).

