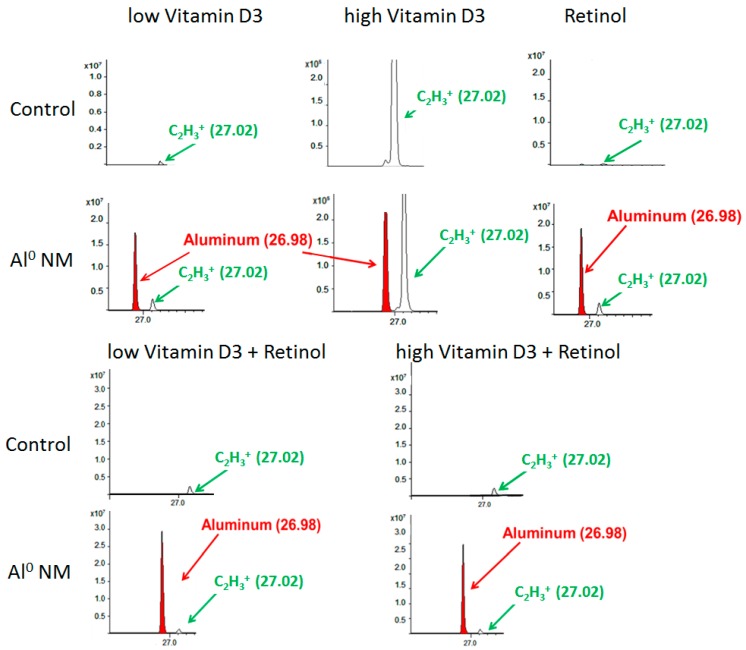
Figure 3.
Time-of-flight secondary ion mass spectrometry (ToF-SIMS) mass spectrum (positive mode), showing the Al peak in red color (at m/e 26.98 u) and a peak in green color (at 27.02 u = C2H3+), resulting from organic matter in HaCaT cells. The upper line shows the spectra for control HaCaT cells, the lower line for HaCaT cells which were exposed to Al NMs (about 20 nm) for 24 h in addition to high or low vitamin D3, and retinol or their combinations. The x-axis shows the mass to charge ratio (m/z); y-axis the ion intensities.

