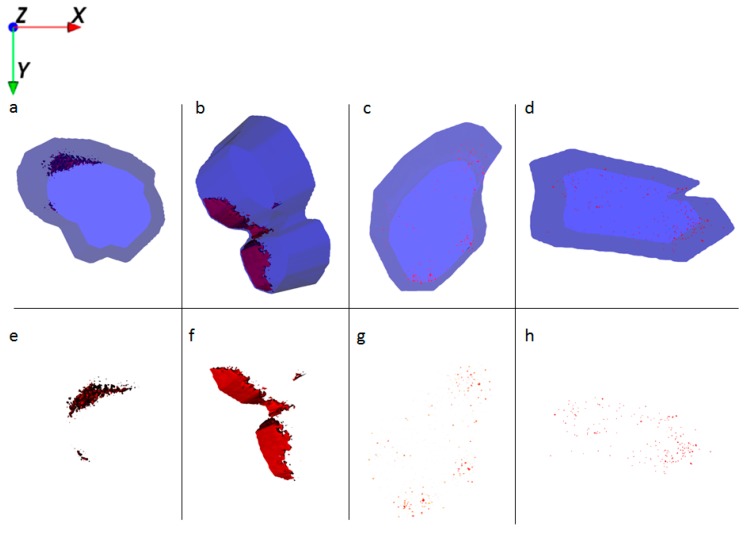
Figure 4.
Ion reconstruction of a 3D depth profile (depth layer numbers: 50–250) of one single HaCaT cell, which was exposed to Al0 NMs for 24 h. The images show the top-down view of the outline of a cell of a depth profile. The translucent blue outline was reconstructed based on the C3H8N+ signal that originates from intracellular amino acids. (a) Control cells treated with Al0 NM only (red color); and corresponding intracellular localization of Al0 NM agglomerates (e). (b) Cells treated with retinol and Al0 NM (red color); and corresponding intracellular localization of Al NM agglomerates (f). (c) Cells treated with low vitamin D3 and Al0 NM (red color); and corresponding intracellular localization of Al0 NM agglomerates (g). (d) Cells treated with high vitamin D3 and Al0 NM (red color); and corresponding intracellular localization of Al0 NM agglomerates (h).

