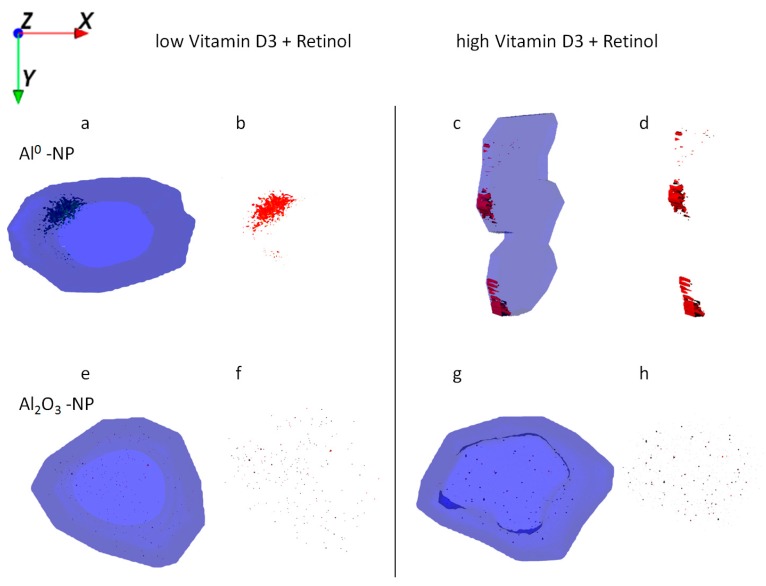
Figure 6.
Ion reconstruction of a 3D depth profile (depth layer numbers: 50–250) of one single HaCaT cell exposed to Al NMs (upper panel a–d) or Al2O3 NMs (lower panel e–h). The 3D depth profile of the cell is depicted as translucent blue. The images show the top-down view into the outline of a cell of a depth profile. In addition to NM treatment low vitamin D3 (a,b,e,f) and high vitamin D3 (c,d,g,h) were administered together with retinol. NM agglomerates are shown in detail next to their respective cell.

