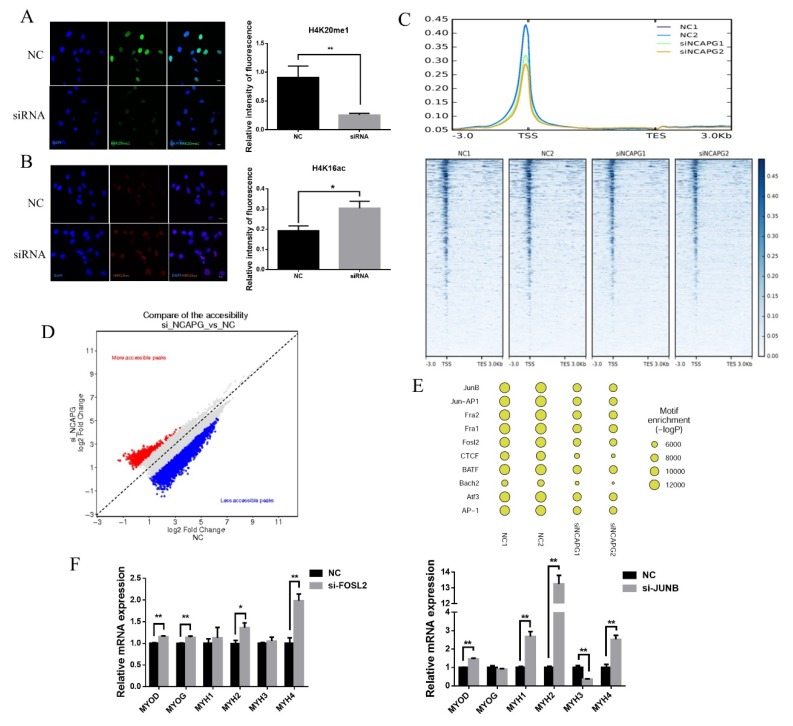
Figure 6.
NCAPG knockdown altered chromatin compaction and accessibility. (A,B) (Left) Representative immunofluorescence images of myoblasts transfected with a negative control or si-NCAPG and stained with antibodies against H4K20me1 (green) or H4K16ac (red). DNA (DAPI) is shown in blue. Scale bars = 10 μm. (Right) Fluorescence intensity quantification. The results are presented as the mean ± the SEM, * p < 0.05, ** p < 0.01. (C) (top) A histogram of the intensity of enriched reads (from TSS −3 kb to TES +3 kb) for each replicate. (bottom) A heatmap of ATAC-seq signal mapping with annotated TSS. (D) Scatterplots showing changes in chromatin accessibility between the NC and si-NCAPG groups. (E) TF motifs identified from ATAC-seq peaks. (F) (Left) Transcript levels of muscle-specific gene expression in AP-1 subunits (FOSL2) in depleted myoblasts. (Right) Transcript levels of muscle-specific gene expression in AP-1 subunits (JUNB) in depleted myoblasts. The results are presented as the mean ± the SEM from at least three independent experiments, * p < 0.05, ** p < 0.01.

