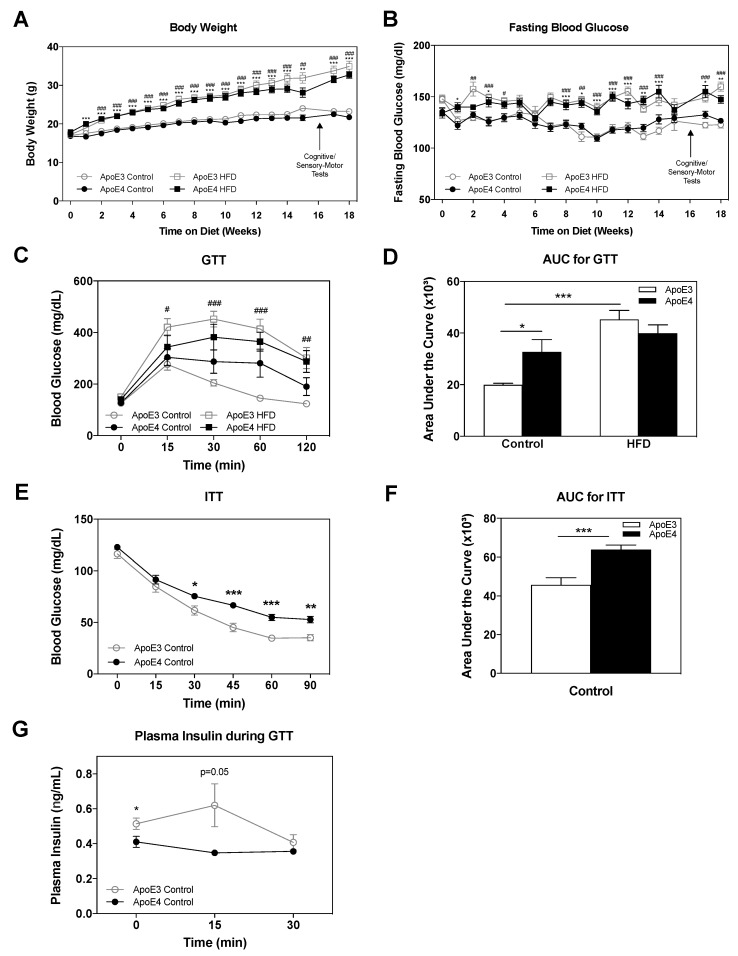
Figure 1.
The effects of APOE genotype and high fat diet (HFD) on body weight, glucose metabolism, and insulin resistance. Following weaning, apoE4 and apoE3 mice were subjected to either a control or HFD for 18 weeks. (A) Body weight and (B) fasting blood glucose were monitored weekly following a 6-h fast as indicated. n = 17–18 mice/group. ApoE4 control and HFD comparisons are represented by *, apoE3 control and HFD comparisons are represented by #. (C) Glucose tolerance test (GTT). Blood glucose levels were measured at the indicated time points after an intraperitoneal injection of glucose. ApoE3 control and HFD comparisons are represented by #. n = 8 mice/group. (D) Quantitation of GTT results expressed as area under the curve. (E) Insulin tolerance test (ITT). Blood glucose levels were measured at the indicated time points following an intraperitoneal injection of insulin. n = 10 mice/group. (F) Quantitation of ITT results expressed as area under the curve. (G) Insulin levels in plasma at the indicated time points of GTT. n = 6–7. The areas under the curve of the GTT in (D) and ITT in (F) were calculated using the trapezoidal rule. Data were analyzed via two-way ANOVA, repeated measures when appropriate, with Bonferroni post-hoc comparisons; ITT results were analyzed via Student’s t-test. Data is presented as mean ± SEM, */# p < 0.05, ** /##p < 0.01 and ***/### p < 0.001.

