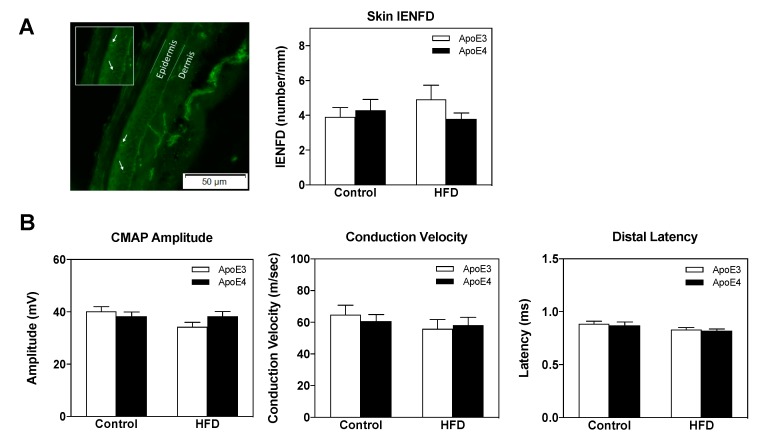
Figure 3.
Skin intra-epidermal nerve fiber density (IENFD) and electrophysiological findings in apoE4 and apoE3 mice maintained on a control or high fat diet (HFD). (A) Skin IENFD measurements were conducted on footpad tissue, which was reacted with anit-PGP9.5 Ab as described in the materials and methods. A representative image of apoE3 control diet mice is depicted on the left panel, green fluorescence corresponds to PGP9.5 and white arrows correspond to intra-epidermal nerves. Quantitation of nerve fiber density per mm is presented in the right panel. n = 8–10 mice/group. (B) Electrophysiological measurements were conducted on the sciatic nerve as indicated in the materials and methods. Proximal compound muscle action potential (CMAP) amplitudes are depicted in the left panel. Motor nerve conduction velocity (MNCV) is presented in the middle panel. Distal latency was measured and MNCV was calculated as per the measured distance between stimulating cathodes. Distal latency is presented in the right panel. n = 10 mice/group. Data were analyzed via two-way ANOVA with Bonferroni post-hoc comparisons and the results were normalized relative to apoE3 control diet mice. Results are mean ± SEM.

