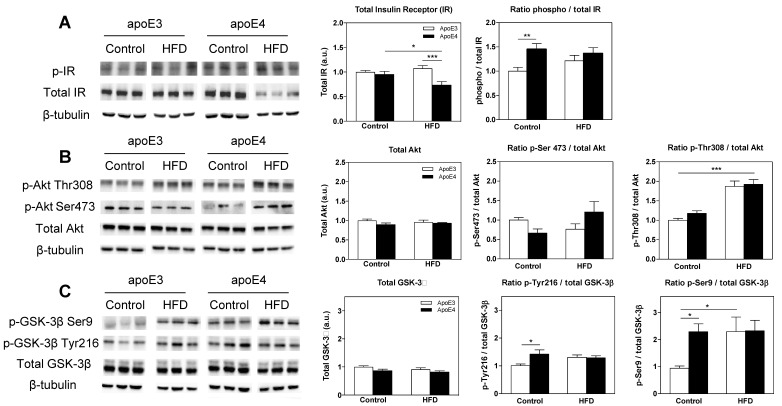
Figure 4.
The effects of the APOE genotype and high fat diet (HFD) on insulin signaling parameters in the hippocampus. Hippocampal homogenates of apoE3 and apoE4 mice subjected to a control diet or HFD were blotted and reacted with indicated antibodies as described in the materials and methods. Representative immunoblots of three mice per group are presented on the left panel along with the β-tubulin loading control. Quantitation of the bands is presented in the right panels, such that the total levels of the parameter are presented in the left graphs and activated levels in the right graphs as presented by the ratio of the phosphorylated molecule to its total level. (A) Total and phosphorylated insulin receptor (IR) levels. n = 15–22 mice/group. (B) Total Akt, p-Akt Thr308, and p-Akt Ser273. n = 6–11 mice/group. (C) Total glycogen synthase kinase-3β (GSK-3β), p-GSK-3β Tyr216, and p-GSK-3β Ser9. n = 11–17 mice/group. ApoE3 mice are depicted in white bars and corresponding apoE4 mice are depicted in black bars. β-tubulin was used as a loading reference, and the results presented were normalized relative to the apoE3 control diet mice. Data were analyzed via two-way ANOVA with Bonferroni post-hoc comparisons, and results are mean ± SEM; * p < 0.05, **p < 0.01, and *** p < 0.001.

